. 2013 Oct 11:6:40.
doi: 10.1186/1755-8794-6-40.

Intratumoral genetic heterogeneity in metastatic melanoma is accompanied by variation in malignant behaviors

Affiliations

Intratumoral genetic heterogeneity in metastatic melanoma is accompanied by variation in malignant behaviors

Matthew Anaka et al. BMC Med Genomics. .

Abstract

Background: Intratumoral heterogeneity is a major obstacle for the treatment of cancer, as the presence of even minor populations that are insensitive to therapy can lead to disease relapse. Increased clonal diversity has been correlated with a poor prognosis for cancer patients, and we therefore examined genetic, transcriptional, and functional diversity in metastatic melanoma.

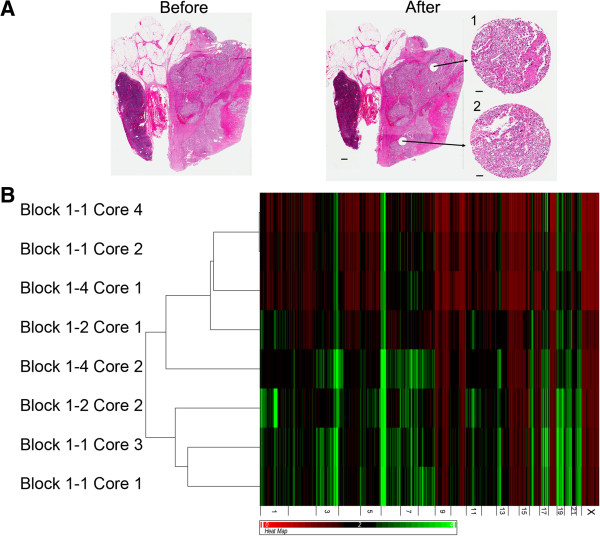
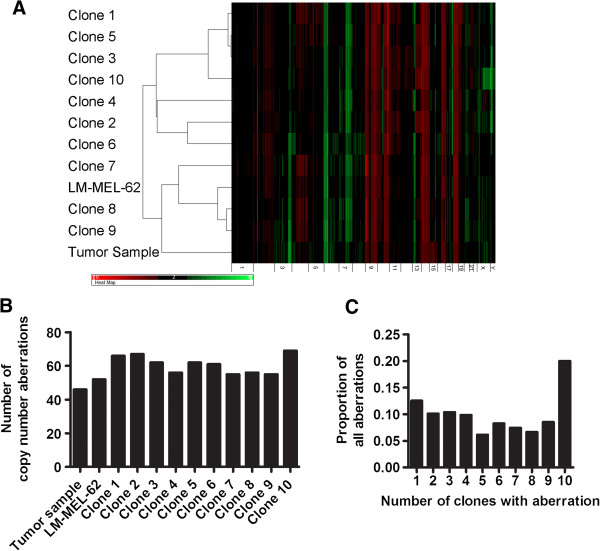
Methods: Amplicon sequencing and SNP microarrays were used to profile somatic mutations and DNA copy number changes in multiple regions from metastatic lesions. Clonal genetic and transcriptional heterogeneity was also assessed in single cell clones from early passage cell lines, which were then subjected to clonogenicity and drug sensitivity assays.

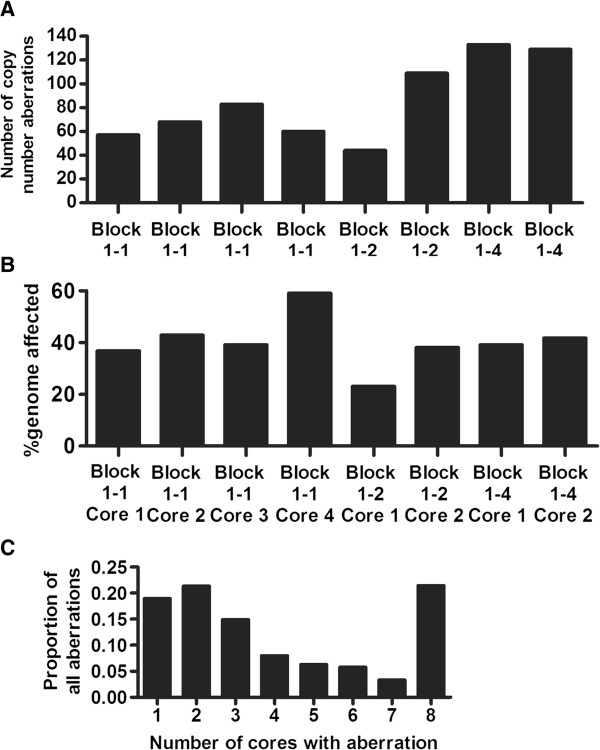
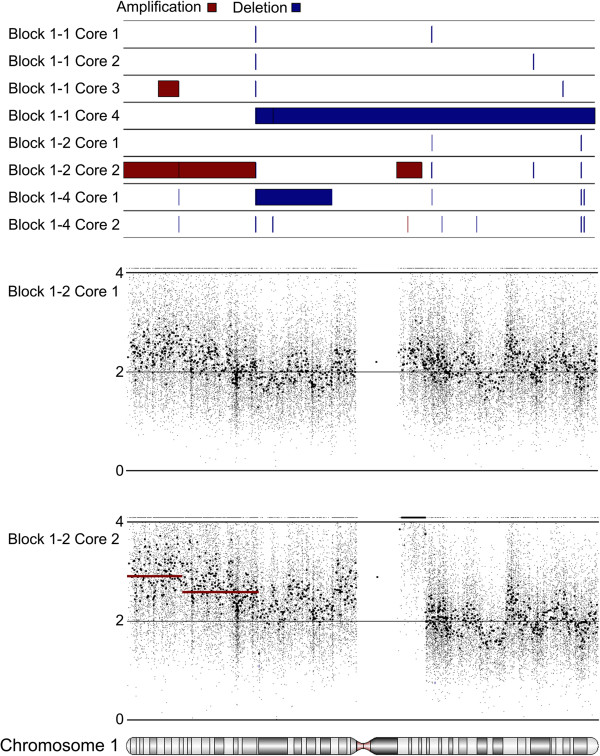
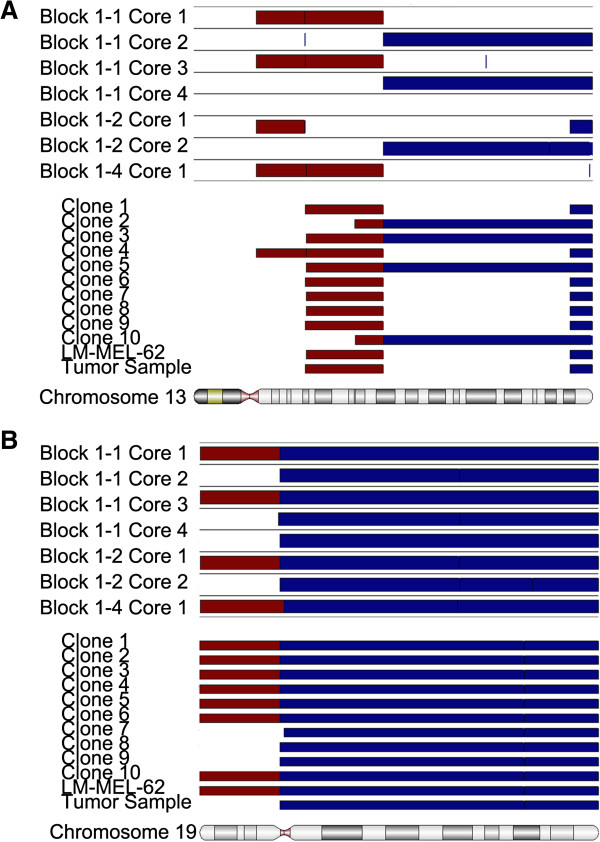
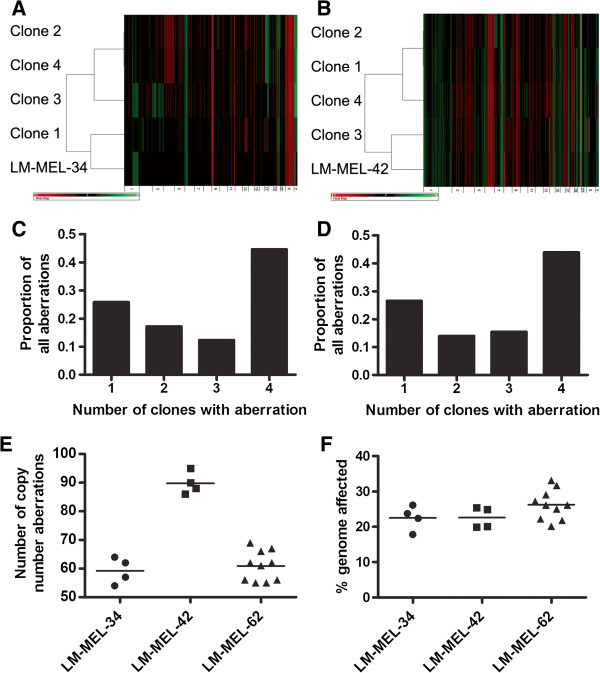
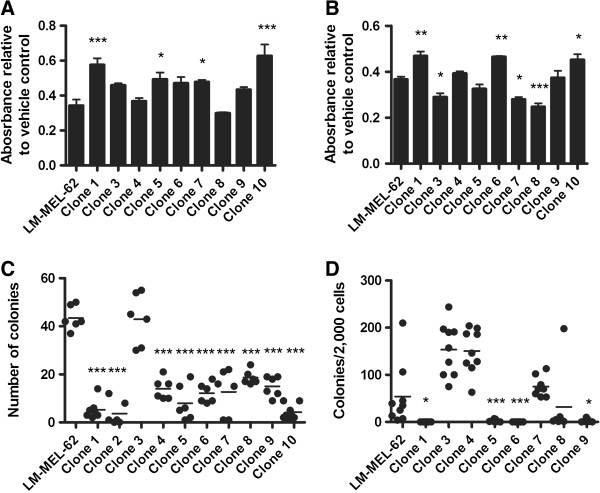
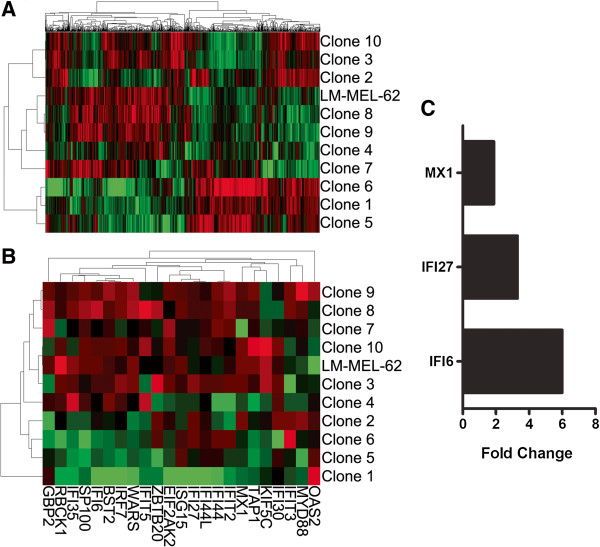
Results: MAPK pathway and tumor suppressor mutations were identified in all regions of the melanoma metastases analyzed. In contrast, we identified copy number abnormalities present in only some regions in addition to homogeneously present changes, suggesting ongoing genetic evolution following metastatic spread. Copy number heterogeneity from a tumor was represented in matched cell line clones, which also varied in their clonogenicity and drug sensitivity. Minor clones were identified based on dissimilarity to the parental cell line, and these clones were the most clonogenic and least sensitive to drugs. Finally, treatment of a polyclonal cell line with paclitaxel to enrich for drug-resistant cells resulted in the adoption of a gene expression profile with features of one of the minor clones, supporting the idea that these populations can mediate disease relapse.

Conclusion: Our results support the hypothesis that minor clones might have major consequences for patient outcomes in melanoma.


Figures

Figure 1
Figure 1
Copy number heterogeneity between different regions of a metastatic melanoma tissue sample. A) Representative H&E staining of section of FFPE block from Tumor 1 before coring and after coring. Inserts in the ‘after’ panel are H&E stains from the bottom of the core fragment used for DNA isolation. Scale bar next to whole section represents 1 mm, bars next to cores represent 100 μm. B) Hierarchical clustering and heatmap of copy number data from Tumor 1 cores. Black regions represent normal copy number (2), green represents amplifications, red deletions.
Figure 2
Figure 2
Attributes of copy number variation in different regions of Tumor 1. A) Total number of copy number abnormalities identified in each core. B) Percent of genome affected by copy number abnormalities identified in each core. C) Proportion of cores in which the copy number abnormalities were identified.
Figure 3
Figure 3
Copy number heterogeneity of Chromosome 1 in different regions of Tumor 1. Segmentation results for all eight cores are shown in the top panel; amplification in red, deletions in blue. The plots below show results for Block 1–2 Core 1 and Block 1–2 Core 2 in greater detail. Regions defined by segmentation are highlighted by solid red and blue bars as above. Small dots represent the copy number values of individual array probes, while larger dots represent smoothed data resulting from averaging results from 30 adjacent probes. The high level amplification of 1q21, encompassing SETDB1, can clearly be seen adjacent to the centromere in Core 2 of Block 1–2.
Figure 4
Figure 4
LM-MEL-62 features clonal copy number heterogeneity. A) Hierarchical clustering and heatmap of copy number data from single cell clones of LM-MEL-62, the parental cell line, and a fresh frozen fragment of Tumor 1. Black regions represent normal copy number (2), green represents amplifications, red deletions. B) number of copy number abnormalities found in from single cell clones of LM-MEL-62, the parental cell line, and a fresh frozen fragment of Tumor 1. C) Proportion of clones in which specific copy number changes were identified.
Figure 5
Figure 5
In vitro clonal copy number heterogeneity can recapitulate heterogeneity found in the original tumor. Comparison of amplifications, deletions, and break points identified on Chromosome 13 (A) and Chromosome 19 (B) in FFPE cores from multiple regions of Tumor 1, and matched cell line LM-MEL-62, derived single cell clones, and independent fresh frozen fragment of Tumor 1.
Figure 6
Figure 6
Copy number heterogeneity in single cell clones from metastatic melanoma cell lines LM-MEL-34 and LM-MEL-42. Hierarchical clustering and heatmap of copy number data from single cell clones of LM-MEL-34 (A) and LM-MEL-42 (B) along with the parental cell lines. LM-MEL-34 was established from Tumor 2, while LM-MEL-42 was established from Tumor 3. Black regions represent normal copy number (2), green represents amplifications, red deletions. C) Proportion of clones from LM-MEL-34 in which specific copy number changes were identified. D) Proportion of clones from LM-MEL-42 in which specific copy number changes were identified. E) Total number of copy number abnormalities found in clones from three metastatic melanoma cell lines. F) Percent genome affected by copy number abnormalities found in clones from three metastatic melanoma cell lines.
Figure 7
Figure 7
Functional heterogeneity between clones of LM-MEL-62. Sensitivity of LM-MEL-62 and derived clones to 20nM paclitaxel (A) and 200μM 5FU (B). Values plotted represent a ratio of the MTS absorbance of drug treated samples to vehicle treated controls. Data from Clones were compared to parental LM-MEL-62 by one-way ANOVA with Dunnett’s Multiple Comparison Test. P-value < 0.05 – *; < 0.001 – ***. C) Single cell colony formation assay to measure growth independence of LM-MEL-62 and derived clones. Clones were compared to parental LM-MEL-62 using a one-way ANOVA with Dunnett’s Multiple Comparison Test. P-value < 0.001 – ***. D) Soft-agar colony formation assays to measure anchorage independent growth and clonogenicity of LM-MEL-62 and derived clones. Clones were compared to parental LM-MEL-62 using a one-way ANOVA with Dunnett’s Multiple Comparison Test. P-value < 0.05 – *; < 0.001 – ***.
Figure 8
Figure 8
Gene expression heterogeneity in single cell clones of metastatic melanoma cell line LM-MEL-62. A) Hierarchical clustering based on the 1000 genes with the greatest variants amongst all samples. B) Hierarchical clustering of the LM-MEL-62 and derived clones using genes from MSigDB gene set M9221 with positive enrichment in Clones 1, 5, & 6 (Table 2). C) Expression of interferon-inducible genes was significantly increased in a paclitaxel-resistant LM-MEL-62 derivative relative to the parental cell line (P = 0.0012; paired t-test) based on QPCR analysis.

References

    1. Vogelstein B, Kinzler KW. The multistep nature of cancer. Trends Genet. 1993;9:138–141. doi: 10.1016/0168-9525(93)90209-Z. - DOI - PubMed
    1. Merlo LM, Pepper JW, Reid BJ, Maley CC. Cancer as an evolutionary and ecological process. Nat Rev Cancer. 2006;6:924–935. doi: 10.1038/nrc2013. - DOI - PubMed
    1. Maley CC, Galipeau PC, Finley JC, Wongsurawat VJ, Li X, Sanchez CA, Paulson TG, Blount PL, Risques RA, Rabinovitch PS, Reid BJ. Genetic clonal diversity predicts progression to esophageal adenocarcinoma. Nat Genet. 2006;38:468–473. doi: 10.1038/ng1768. - DOI - PubMed
    1. Yachida S, Jones S, Bozic I, Antal T, Leary R, Fu B, Kamiyama M, Hruban RH, Eshleman JR, Nowak MA. et al.Distant metastasis occurs late during the genetic evolution of pancreatic cancer. Nature. 2010;467:1114–1117. doi: 10.1038/nature09515. - DOI - PMC - PubMed
    1. Gerlinger M, Rowan AJ, Horswell S, Larkin J, Endesfelder D, Gronroos E, Martinez P, Matthews N, Stewart A, Tarpey P. et al.Intratumor heterogeneity and branched evolution revealed by multiregion sequencing. N Engl J Med. 2012;366:883–892. doi: 10.1056/NEJMoa1113205. - DOI - PMC - PubMed

Publication types