. 2013 Oct 10;155(2):397-409.
doi: 10.1016/j.cell.2013.09.025.

PKM2 isoform-specific deletion reveals a differential requirement for pyruvate kinase in tumor cells

Affiliations

PKM2 isoform-specific deletion reveals a differential requirement for pyruvate kinase in tumor cells

William J Israelsen et al. Cell. .

Abstract

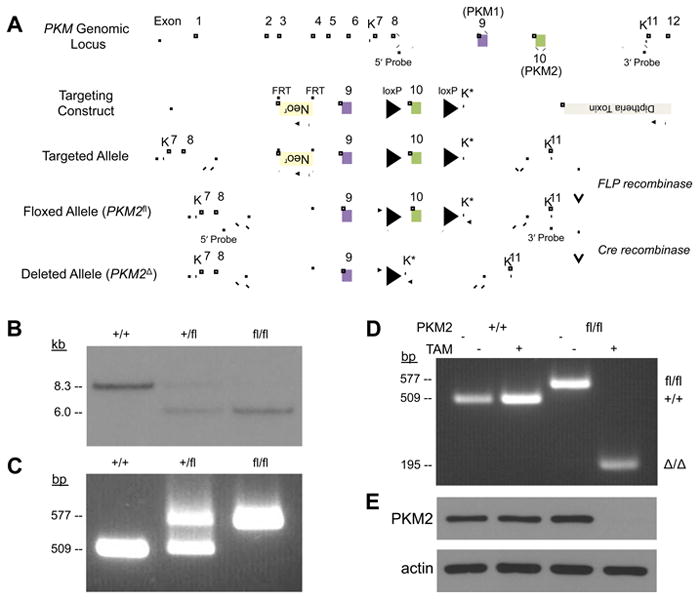
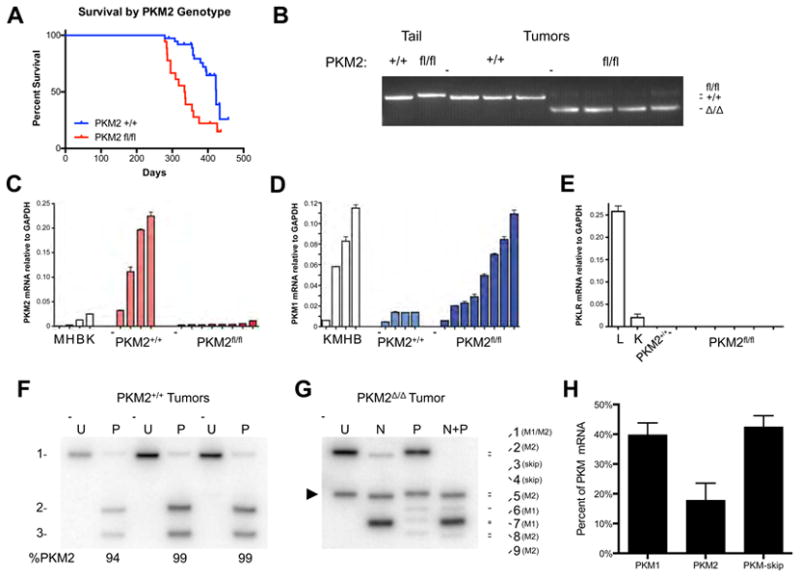
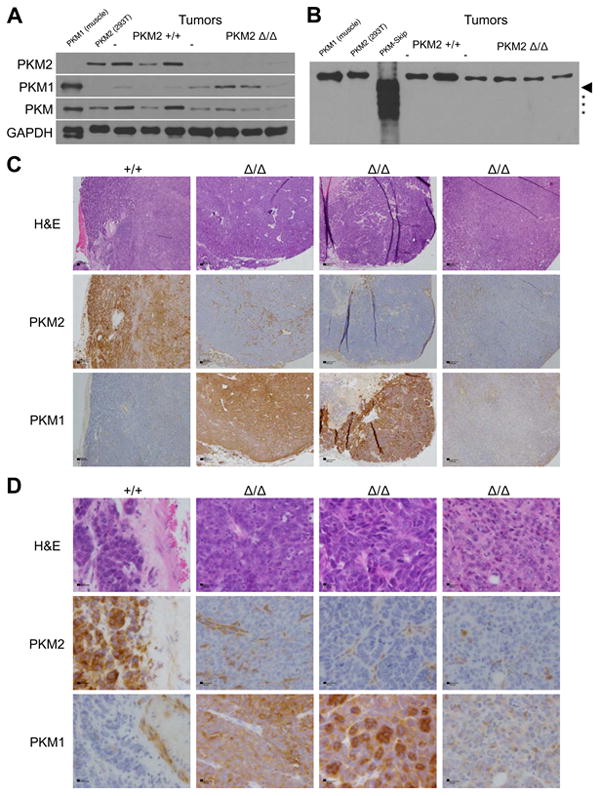
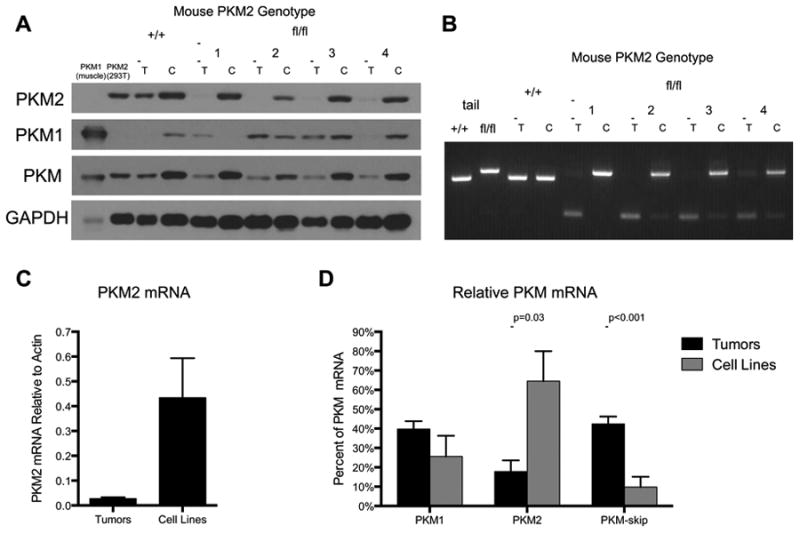
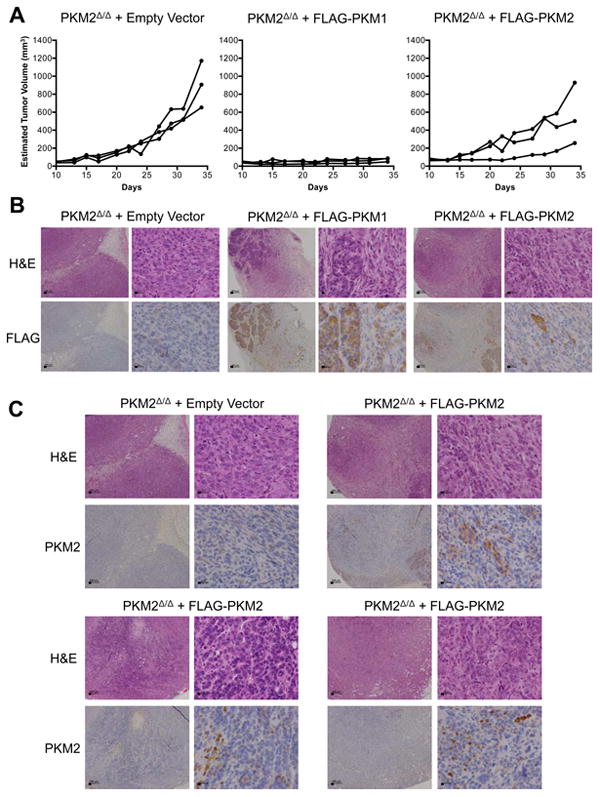
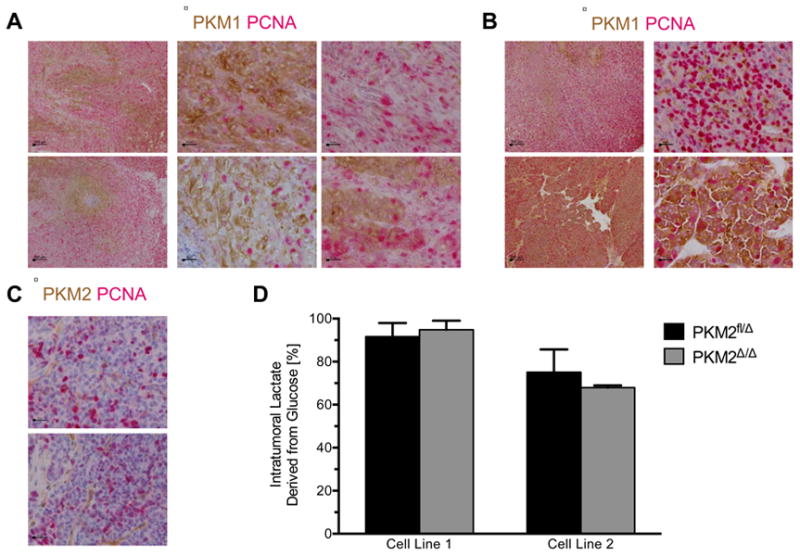
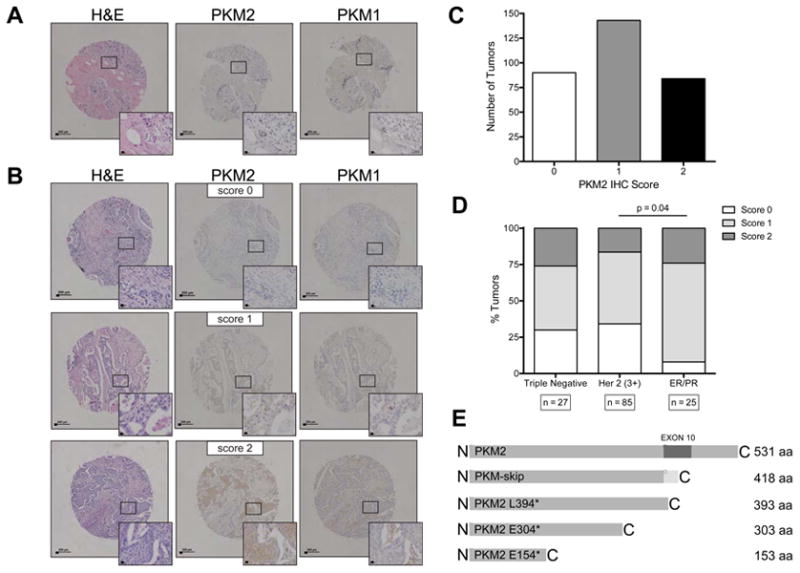
The pyruvate kinase M2 isoform (PKM2) is expressed in cancer and plays a role in regulating anabolic metabolism. To determine whether PKM2 is required for tumor formation or growth, we generated mice with a conditional allele that abolishes PKM2 expression without disrupting PKM1 expression. PKM2 deletion accelerated mammary tumor formation in a Brca1-loss-driven model of breast cancer. PKM2 null tumors displayed heterogeneous PKM1 expression, with PKM1 found in nonproliferating tumor cells and no detectable pyruvate kinase expression in proliferating cells. This suggests that PKM2 is not necessary for tumor cell proliferation and implies that the inactive state of PKM2 is associated with the proliferating cell population within tumors, whereas nonproliferating tumor cells require active pyruvate kinase. Consistent with these findings, variable PKM2 expression and heterozygous PKM2 mutations are found in human tumors. These data suggest that regulation of PKM2 activity supports the different metabolic requirements of proliferating and nonproliferating tumor cells.


Figures

Figure 1
Figure 1. Generation and validation of PKM2 conditional mice
(A) The mouse PKM locus, targeting construct, and the resulting targeted, floxed and deleted alleles. The KpnI sites used for Southern blot analysis are marked with “K”, and the new KpnI site introduced by the targeting vector is marked with “K*”. The locations of the 5' and 3' Probes used for Southern blot analysis are also shown. (B) Southern blot analysis of KpnI-digested genomic DNA using a 5' Probe. Digestion of the wild-type PKM allele yields an ∼8.3 kb fragment and the floxed allele yields a ∼6.0 kb fragment. (C) PCR genotyping of genomic DNA from PKM2+/+, PKM2+/fl, and PKM2fl/fl mice. Genotyping primers anneal outside of the loxP sites as indicated by arrows in (A), and produce amplicons of 509 bp from the PKM2+ allele and 577 bp from the PKM2fl allele. (D) PCR genotyping of PKM2+/+ Cre-ER and PKM2fl/fl Cre-ER MEFs that were treated with 4-hydroxytamoxifen (TAM) or mock treated. The PKM2Δ allele produces a 195 bp amplicon. (E) Western blot analysis of PKM2 protein from MEFs as specified in (D). See also Figure S1.
Figure 2
Figure 2. PKM exon 10 deletion in mammary tumors results in accelerated mortality and variable production of PKM1 mRNA
(A) Kaplan-Meier survival curve comparing PKM2+/+ and PKM2fl/fl mice with BRCA1fl/fl MMTV-Cre p53+/- alleles. (B) PCR genotyping of the PKM2 allele in PKM2+/+ and PKM2Δ/Δ mammary tumors. Analysis of tail DNA from PKM2+/+ and PKM2fl/fl mice is shown as a control. (C) PKM2 mRNA levels in PKM2+/+ and PKM2Δ/Δ tumors by quantitative RT-PCR, with normal mouse tissue controls: M, muscle; H, heart; B, brain; K, kidney. (D) PKM1 mRNA levels in PKM2+/+ and PKM2Δ/Δ tumors by quantitative RT-PCR, with normal mouse tissue controls: K, kidney; M, muscle; H, heart; B, brain. (E) PKLR mRNA levels in PKM2+/+ and PKM2Δ/Δ tumors by quantitative RT-PCR, with normal mouse tissue controls: L, liver; K, kidney. (F) Autoradiograph of Uncut [U] and PstI [P] digested PKM cDNA amplicons. Uncut PKM1 and PKM2 amplicons are of identical length (band 1). PstI digests only the PKM2 amplicon to produce bands 2 and 3. Results from three representative PKM2+/+ tumors are shown with quantification. See Figures S2C and E for a schematic of how each band is generated. (G) Autoradiograph of Uncut [U] and digested PKM cDNA amplicons from a representative PKM2Δ/Δ tumor. Uncut PKM1 and PKM2 amplicons are of identical length (band 1), and the amplicon corresponding to the PKM-skip mis-spliced product is marked with an arrowhead (band 3). NcoI [N] digests the PKM1 amplicon and PstI [P] digests the PKM2 amplicon. Figures S2C,D,F show how each band is generated. (H) Quantification of PKM splicing in PKM2Δ/Δ tumors, as determined from autoradiographs as in (G). Data are displayed as means ± s.e.m, n=4. See also Figure S2.
Figure 3
Figure 3. PKM exon 10 deletion in mammary tumors leads to variable expression of PKM protein
(A) PKM2, PKM1, and total PKM protein levels in PKM2+/+ and PKM2Δ/Δ tumors. Muscle and 293T cell lysates serve as PKM1 and PKM2 protein controls, respectively, with GAPDH as loading control. (B) PKM protein in PKM2+/+ and PKM2Δ/Δ tumors visualized using a monoclonal anti-PKM antibody with an epitope common to PKM1 and PKM2. Muscle and 293T cell lysates serve as PKM1 and PKM2 protein controls, respectively. The size of full-length PKM-skip is marked with an arrowhead and PKM-skip degradation products are marked with asterisks. This blot was intentionally over-exposed. (C) Histology and staining of one PKM2+/+ tumor and three PKM2Δ/Δ tumors for PKM2 or PKM1. Scale bars represent 200 μm. (D) High power micrographs of the same tumors as in (C). Scale bars represent 20 μm. See also Figure S3.
Figure 4
Figure 4. Cell lines derived from PKM2Δ/Δ mammary tumors retain expression of PKM2
(A) PKM2, PKM1, and total PKM protein levels in tumors [T] from PKM2+/+ and PKM2fl/fl mice and their derivative cell lines [C]. Muscle and 293T cell lysates serve as PKM1 and PKM2 protein controls, respectively, with GAPDH as loading control. (B) PCR genotyping of tumors [T] from PKM2+/+ and PKM2fl/fl mice and their derivative cell lines [C]. Analysis of tail DNA from PKM2+/+ and PKM2fl/fl mice is shown as control. (C) PKM2 mRNA levels in PKM2Δ/Δ tumors and derivative cell lines by quantitative RT-PCR. Data are shown as means ± s.e.m, n=4 tumors, n=3 cell lines. (D) Quantification of PKM splicing in PKM2Δ/Δ tumor-derived cell lines and parent tumors determined as shown in Figure 2G. Data are displayed as means ± s.e.m, n=4 tumors, n=4 cell lines. P-values were obtained by Student's t-test. See also Figure S4.
Figure 5
Figure 5. Allograft tumor growth does not select for PKM2 expression
(A) Growth curves of tumors formed by PKM2Δ/Δ cells expressing empty vector, FLAG-PKM1, or FLAG-PKM2 following injection into nude mice. (B) Representative anti-FLAG and H&E staining of tumor sections from the allograft experiment shown in (A). Scale bars represent 200 μm and 20 μm at low and high magnification, respectively. (C) Anti-PKM2 and H&E staining of a representative PKM2Δ/Δ empty vector tumor and three PKM2Δ/Δ FLAG-PKM2 tumors. The top right PKM2Δ/Δ FLAG-PKM2 tumor is the same PKM2Δ/Δ FLAG-PKM2 tumor shown in (B). Scale bars represent 200 μm and 20 μm at low and high magnification, respectively.
Figure 6
Figure 6. Tumor cells proliferate in the absence of PKM2, but not in the presence of PKM1
(A) PKM2Δ/Δ allograft tumors dual-stained for PKM1 (brown) and PCNA (red). Scale bars represent 200 μm and 20 μm at low and high magnification, respectively. (B) PKM2Δ/Δ tumors from BRCAfl/flMMTV-Cre p53+/- mice dual-stained for PKM1 (brown) and PCNA (red). Scale bars represent 200 μm and 20 μm at low and high magnification, respectively. (C) PKM2Δ/Δ tumors from BRCAfl/flMMTV-Cre p53+/- mice dual-stained for PKM2 (brown) and PCNA (red). Scale bars represent 20 μm. (D) The percent lactate derived from glucose in PKM2fl/Δ and PKM2Δ/Δ allograft tumors was determined from 13C-lactate labeling in tumors normalized to 13C-glucose serum enrichment levels. Results from two independent tumor cell line allografts are displayed as means ± s.e.m (n=8 for Line 1 tumors of both genotypes; n=4 for Line 2 PKM2fl/Δ tumors and n = 5 for Line 2 PKM2Δ/Δ tumors). See also Figure S5.
Figure 7
Figure 7. Human breast tumors show variable expression of PKM2
(A) Representative TMA cores containing normal human breast stained with H&E, and for PKM2 and PKM1. Insets show higher magnification. Scale bars represent 200 μm and 20 μm at low and high magnification, respectively. (B) Representative TMA cores containing human breast tumor samples stained with H&E, and for PKM2 and PKM1. An example of each PKM2 IHC intensity score is shown (0=negative; 1=weak; 2=strong). Insets show higher magnification. Scale bars represent 200 μm and 20 μm at low and high magnification, respectively. (C) Distribution of PKM2 IHC intensity scores of 317 tumors from two different TMAs containing breast tumor samples. (D) Quantification of PKM2 expression in human breast tumors relative to breast tumor subtype (triple negative, Her2 amplified, or ER/PR positive). The distribution of PKM2 scores is significantly different between Her2 amplified samples and ER/PR positive samples by Chi-square test (P=0.038). (E) Schematic showing truncations of PKM2 caused by mutations found in human cancers.

References

    1. Allali-Hassani A, Wasney GA, Chau I, Hong BS, Senisterra G, Loppnau P, Shi Z, Moult J, Edwards AM, Arrowsmith CH, et al. A survey of proteins encoded by non-synonymous single nucleotide polymorphisms reveals a significant fraction with altered stability and activity. The Biochemical journal. 2009;424:15–26. - PubMed
    1. Anastasiou D, Poulogiannis G, Asara JM, Boxer MB, Jiang JK, Shen M, Bellinger G, Sasaki AT, Locasale JW, Auld DS, et al. Inhibition of pyruvate kinase M2 by reactive oxygen species contributes to cellular antioxidant responses. Science. 2011;334:1278–1283. - PMC - PubMed
    1. Anastasiou D, Yu Y, Israelsen WJ, Jiang JK, Boxer MB, Hong BS, Tempel W, Dimov S, Shen M, Jha A, et al. Pyruvate kinase M2 activators promote tetramer formation and suppress tumorigenesis. Nat Chem Biol. 2012:1–9. - PMC - PubMed
    1. Ayala JE, Samuel VT, Morton GJ, Obici S, Croniger CM, Shulman GI, Wasserman DH, McGuinness OP. Standard operating procedures for describing and performing metabolic tests of glucose homeostasis in mice. Dis Model Mech. 2010;3:525–534. - PMC - PubMed
    1. Baumhoer D, Tornillo L, Stadlmann S, Roncalli M, Diamantis EK, Terracciano LM. Glypican 3 expression in human nonneoplastic, preneoplastic, and neoplastic tissues: a tissue microarray analysis of 4,387 tissue samples. American journal of clinical pathology. 2008;129:899–906. - PubMed

Publication types

MeSH terms