. 2013 Oct 10;155(2):448-61.
doi: 10.1016/j.cell.2013.09.018.

The dynamics of signaling as a pharmacological target

Affiliations

The dynamics of signaling as a pharmacological target

Marcelo Behar et al. Cell. .

Abstract

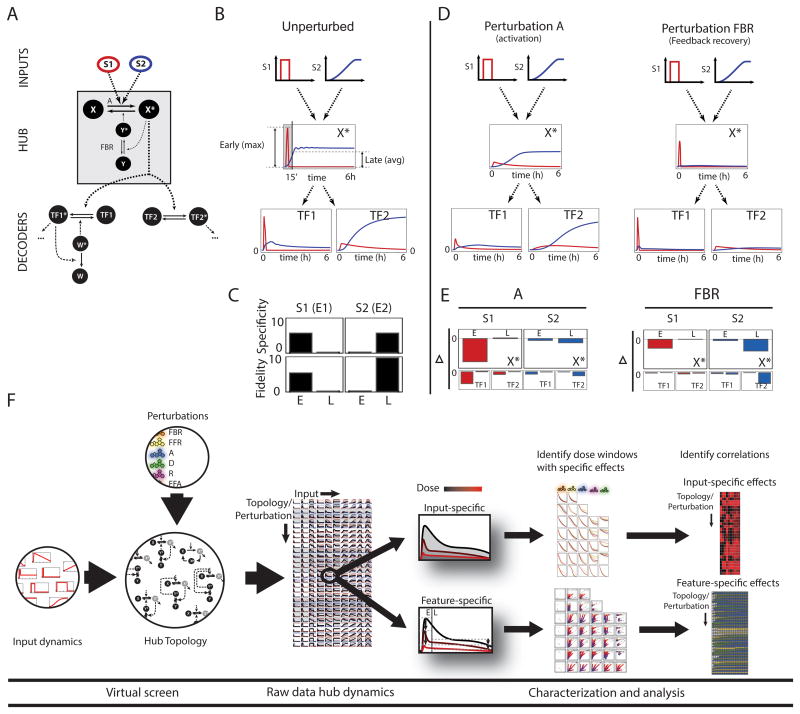
Highly networked signaling hubs are often associated with disease, but targeting them pharmacologically has largely been unsuccessful in the clinic because of their functional pleiotropy. Motivated by the hypothesis that a dynamic signaling code confers functional specificity, we investigated whether dynamic features may be targeted pharmacologically to achieve therapeutic specificity. With a virtual screen, we identified combinations of signaling hub topologies and dynamic signal profiles that are amenable to selective inhibition. Mathematical analysis revealed principles that may guide stimulus-specific inhibition of signaling hubs, even in the absence of detailed mathematical models. Using the NFκB signaling module as a test bed, we identified perturbations that selectively affect the response to cytokines or pathogen components. Together, our results demonstrate that the dynamics of signaling may serve as a pharmacological target, and we reveal principles that delineate the opportunities and constraints of developing stimulus-specific therapeutic agents aimed at pleiotropic signaling hubs.


Figures

Figure 1
Figure 1. Pharmacologic perturbations with stimulus-specific effects
A) A negative feedback module transduces input signals S1 and S2 producing outputs that are decoded by downstream effectors circuits that may distinguish between different dynamics. B) Unperturbed dynamics of X*, TF1*, and TF2* in response to S1 (red) and S2 (blue). Definition of early (E) and late (L) parts of the signal is indicated. C) Specificity and fidelity of E and L for TF1* and TF2*, as defined in (Komarova et al., 2005). D) Partial inhibition of X* activation (A) abolishes the response to S1 but not S2, whereas a perturbation targeting the feedback regulator (FBR) suppresses the response to S2 but not S1. E) Perturbation phenotypes defined as difference between unperturbed and perturbed values of the indicated quantities (arbitrary scales for X*, TF1*, and TF2*). Perturbation A inhibits E and TF1* but not TF2*; perturbation FBR inhibits L and TF2* but not TF1*. F) Virtual screening pipeline showing the experimental design and the two analysis branches for characterizing feature- and input-specific effects. Details in methods and Table S1.
Figure 2
Figure 2. A virtual screen for stimulus-specificity in pharmacologic perturbations
A) Signaling modules (left) and input library (top) used in the screen. Dotted lines indicate enzymatic reactions (perturbation names indicated). Time courses of hub activity for each module/input combination for the unperturbed (black) and perturbed cases (blue indicates a decrease, red an increase in parameter value). B) Relative inhibitory effects of perturbations normalized per row (See methods and Figure S1).
Figure 3
Figure 3. Inhibition of specific dynamic signaling features
A) Feature maps: effect of a perturbation on the maximum early (t<60′) amplitude (y axis) and late (60′0 L specificity) Top: Perturbation FBR (M3) suppresses late signaling in an input-independent manner. Center: FFA attenuates early or late signaling in an input-dependent manner. Bottom: E-L specificity switch for two doses of FBA (M3). C) Hierarchical clustering of the inhibitory effects (left) compared to number of input signals showing selective inhibition of early (blue), late (yellow), or both (green) parts of the output. Bars represent different perturbations doses. (See methods and Figure S2).
Figure 4
Figure 4. Phase space analysis of signaling modules’ responses
A) Quasi-equilibrium surfaces for X* (orange) and Y* (green) as functions of stimulus strength s, and 2D projections for low (sL) and high (sH) s levels in feedback-based module M3. The time course of X* in response to a fast (red) and slow gradual (blue) input are indicated. Strict quasi-steady response in black B) Effect of perturbation A in module M3. The arrow indicates whether the perturbation suppresses (−) or enhances (+) the reaction. C) Cross sections of the X* and Y* (orange and green) surfaces for low and high S and the projection of the time-course concentrations of X*-Y* for fast and gradually changing signals (red/blue). Projection of the q.e. line indicated with a dashed black line. Corresponding time courses shown on the right (topmost curve corresponds to higher values of parameter). The perturbation primarily affects steady state levels (transition from left to center panels when the feedback saturates and out-of-equilibrium and quasi-equilibrium dynamics otherwise (transition from center to right panels). D) Effect of perturbation FBR (M3) E) Effect of perturbation A on module M4 and, F) the corresponding two-dimensional projections. Notice how the intersection (black line) of the surfaces defines a peak of activity. Additional details in methods and Figure S3.
Figure 5
Figure 5. Modulating NFκB Signaling Dynamics
A) The IκB-NFκB signaling module. B) Dose response relationship for NFκB vs. IKK C) Three IKK curves representative of three stimulation regimes; TNFc (red), TNFp (green), LPS (blue) function as inputs into the model which computes the corresponding NFκB activity dynamics. The quasi-equilibrium line (black) was obtained by transforming the IKK temporal profiles by the dose response in B. Deviation from the q.e. line for the TNF response indicates out-of-equilibrium dynamics. D) Coarse-grained model of the IκB-NFκB module and predicted effects of perturbations. E) Selected perturbations with specific effects on out-of-equilibrium (top three) or steady state (bottom two). From left to right: feature maps in the E-L space (E: t<60′, L: 120′0 indicates L is more suppressed than E and vice versa), and time courses (Green: TNF chronic; Red: TNF pulse; Blue: LPS). Only inhibitory perturbations shown. See Figure S4 for additional perturbations.
Figure 6
Figure 6. Stimulus-specific pharmacological perturbations of NFκB signaling
A–C) Simulated and observed effects of pharmacological inhibitors on NFκB activity. Leftmost bar-graph panels show NFκB activity predicted at indicated time points in MEFs in response to TNFc (red), TNFp (green) and LPS (blue) in the absence of pharmacologic inhibitors. Center and right bar graphs show computational predictions in response to the same stimuli under drug treatments. Asterisks indicate effects greater than two fold thought to be experimentally detectable. Upper rows of gel images: electrophoretic mobility shift assays (EMSAs) of NFκB activity. Bottom gel images: RNAse Protection analysis (RPA) revealing the effect on the indicated NFκB target genes (See Table S7).
Figure 7
Figure 7. Time scales of cellular processes relevant for signaling
Order of magnitude timescales associated with intracellular processes that can be combined to produce complex signaling networks. Combinations including processes with different time scales can result in responses with significant out-of-equilibrium components whereas similar time-scales will likely produce quasi-equilibrium dynamics. The time scale difference must be considered in terms relative to the time-scale at which the input signal changes.

Comment in

References

    1. Bardwell L. Mechanisms of MAPK signalling specificity. Biochem Soc Trans. 2006;34:837–841. - PMC - PubMed
    1. Becker V, Timmer J, Klingmuller U. Receptor dynamics in signaling. Adv Exp Med Biol. 2012;736:313–323. - PubMed
    1. Behar A, Hoffmann A. Tunable Signal Processing through a kinase control cycle: the IKK signaling node. Biophys J. 2013;105:231–41. - PMC - PubMed
    1. Behar M, Dohlman HG, Elston TC. Kinetic insulation as an effective mechanism for achieving pathway specificity in intracellular signaling networks. Proc Natl Acad Sci U S A. 2007;104:16146–16151. - PMC - PubMed
    1. Behar M, Hoffmann A. Understanding the temporal codes of intra-cellular signals. Curr Opin Genet Dev. 2010;20:684–693. - PMC - PubMed

Publication types