. 2013 Oct 10;155(2):462-77.
doi: 10.1016/j.cell.2013.09.034.

The somatic genomic landscape of glioblastoma

Collaborators, Affiliations

The somatic genomic landscape of glioblastoma

Cameron W Brennan et al. Cell. .

Erratum in

  • Cell. 2014 Apr 24;157(3):753

Abstract

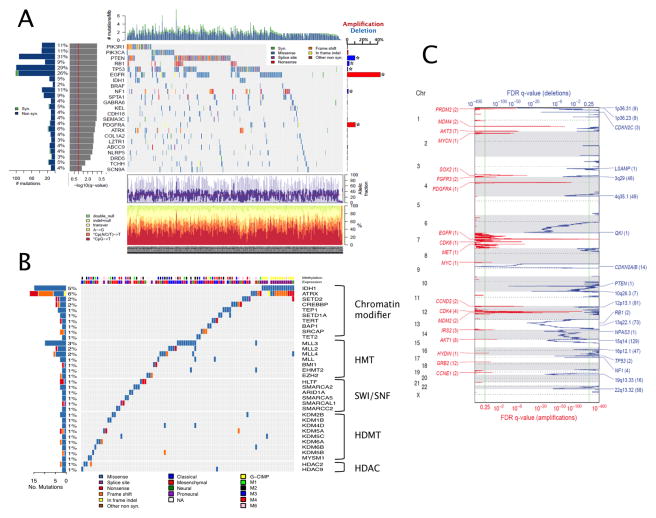
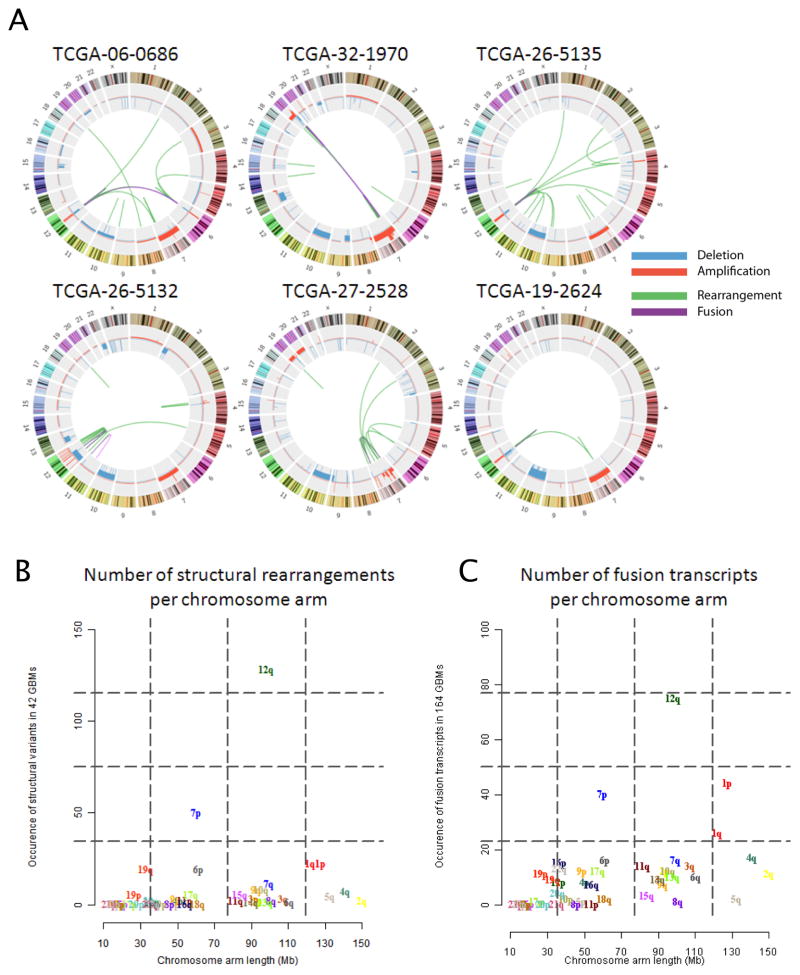
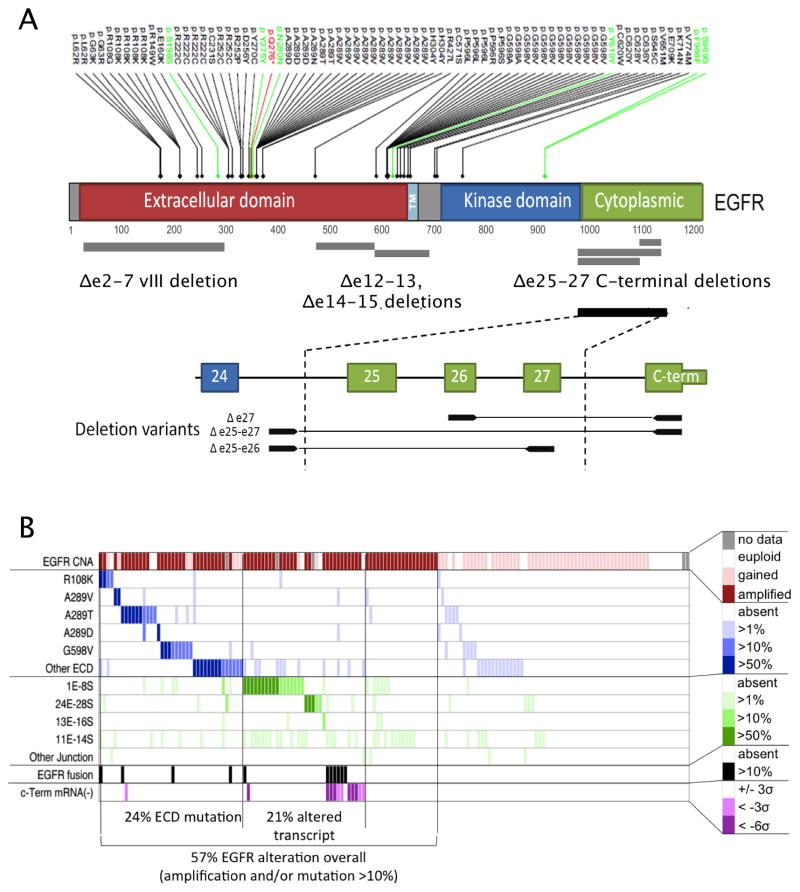
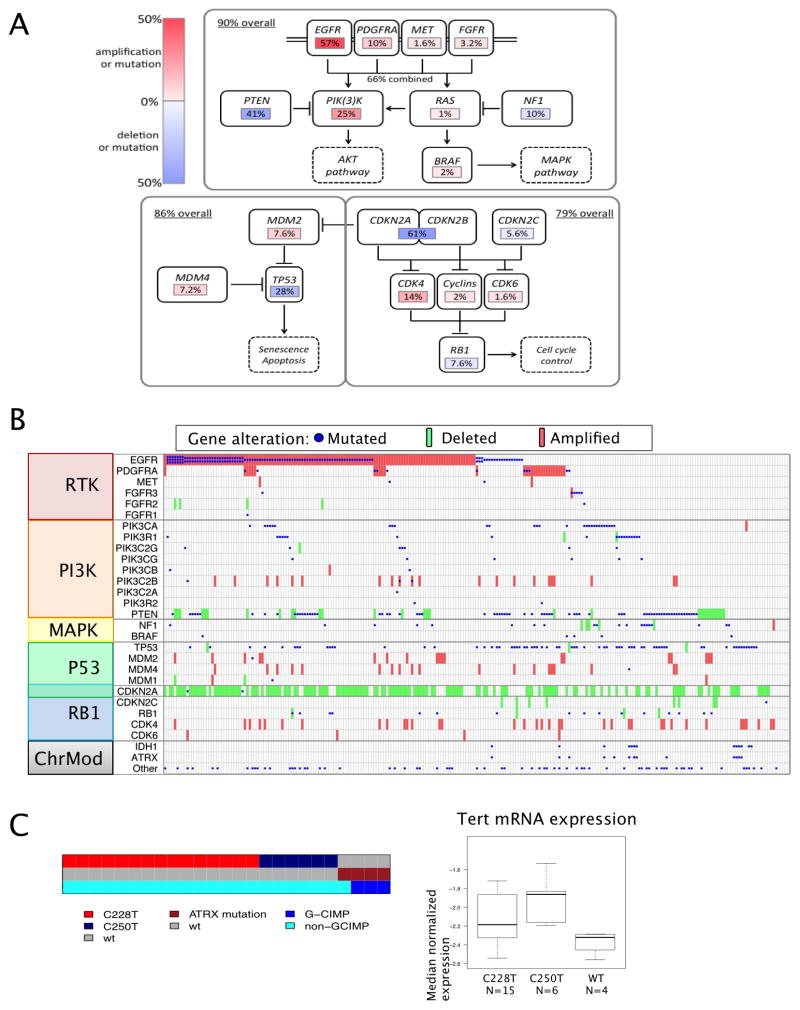
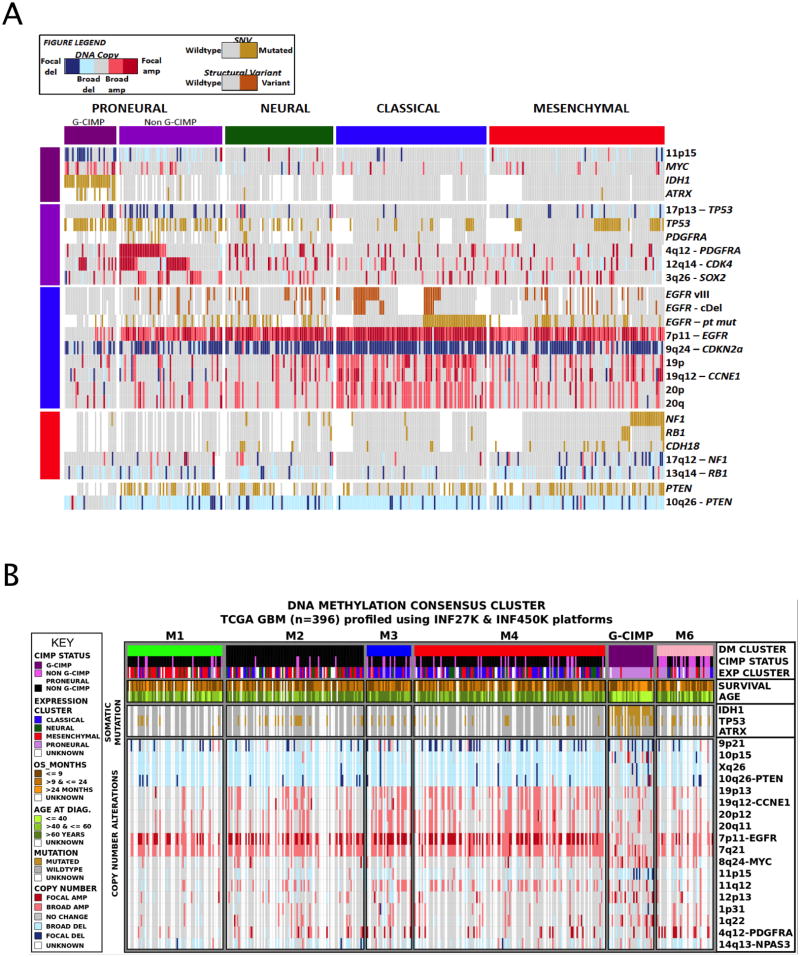
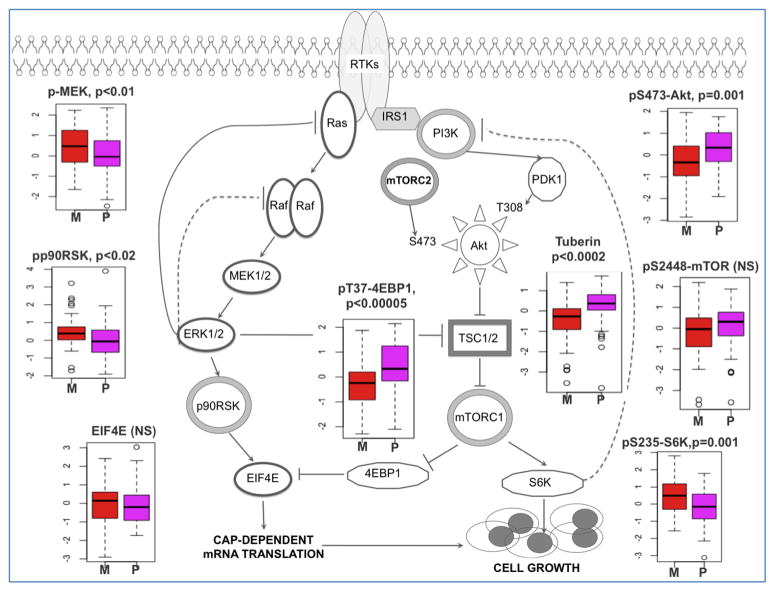
We describe the landscape of somatic genomic alterations based on multidimensional and comprehensive characterization of more than 500 glioblastoma tumors (GBMs). We identify several novel mutated genes as well as complex rearrangements of signature receptors, including EGFR and PDGFRA. TERT promoter mutations are shown to correlate with elevated mRNA expression, supporting a role in telomerase reactivation. Correlative analyses confirm that the survival advantage of the proneural subtype is conferred by the G-CIMP phenotype, and MGMT DNA methylation may be a predictive biomarker for treatment response only in classical subtype GBM. Integrative analysis of genomic and proteomic profiles challenges the notion of therapeutic inhibition of a pathway as an alternative to inhibition of the target itself. These data will facilitate the discovery of therapeutic and diagnostic target candidates, the validation of research and clinical observations and the generation of unanticipated hypotheses that can advance our molecular understanding of this lethal cancer.


Figures

Figure 1
Figure 1. Somatic genomic alterations in glioblastoma
(A) Summary of significantly mutated genes from 291 exomes. Specific mutations for LZTR1, SPTA1, KEL, and TCHH are shown in SI Figure S2. Upper histogram: Number of mutations per sample (substitutions and indels). Left histogram, rate of mutations per gene and percentage of samples affected. Central heat map: Distribution of significant mutations across sequenced samples, color coded by mutation type. Left histograms: Overall count and significance level of mutations as determined by log(10) transformation of the MutSig q-value. Red line indicates a q-value of 0.05. Right histogram: Summary of focal amplifications (red) and deletion (blue) determined from DNA copy number platforms (asterisk denotes inclusion in statistically significant recurrent CNA by GISTIC). Lower chart: Average fraction of tumor reads versus total number of reads per sample. Bottom chart: top, rates of non-silent mutations within categories indicated by legend; bottom, mutation spectrum of somatic substitutions of samples in each column. (B) Mutations in 38 genes related to specific epigenetic function categories (out of 161 genes linked to chromatin modification) across 98 GBMs (out of 292 GBM). IDH1 mutation status is included to illustrate its co-occurrence with ATRX mutation. An additional 37 GBMs harbored mutations in one of the remaining 129 CMGs. (C) Recurrent sites of DNA copy number aberration determined from 543 samples by the GISTIC algorithm. Statistically significant, focally amplified (red) and deleted (blue) regions are plotted along the genome. Significant regions (FDR<0.25) are annotated with the number of genes spanned by the peak in parentheses. For peaks that contain a putative oncogene or tumor suppressor, the gene is noted.
Figure 2
Figure 2. Structural rearrangements and transcript variants in GBM
(A) Circos plots of structural DNA and RNA rearrangements in six GBMs, selected from 28 cases with available whole genome and RNA sequencing based on their rearrangement frequency. Outer ring indicates chromosomes. Copy number levels are displayed along the chromosome map in red (copy number gain) and blue (copy number loss). Each line in the center maps a single structural variant to the site of origin for both genes (see SI Figure S3 for additional analysis of fusion transcripts derived from RNA sequencing). (B) The chromosome arm of origin of both ends of each rearrangement detected in whole genome sequencing data from 42 GBM were counted and compared to chromosome arm length. (C) The chromosome arm of both partners in fusion transcripts detected from RNA sequencing data from 164 GBM were counted and compared to chromosome arm length.
Figure 3
Figure 3. Somatic alterations of the EGFR locus
(A) EGFR protein domain structure with somatic mutations summarized from 291 GBMs with exome sequencing and transcript alterations identified across 164 GBMs with RNA sequencing. (B) EGFR alterations are summarized by transcript prevalence in 164 GBMs with RNA sequencing. Red, top: focal amplification or regional gain inferred from DNA copy number. Blue: Prevalence of sequencing reads with EGFR point mutation. Green: prevalence of reads with aberrant exon-exon junctions (e.g., 1E–8S is a junction spanning from the end of exon 1 to the start of exon 8, consistent with EGFRvIII mutation). Black: EGFR fusion transcript detected (see rearrangements). See related SI Figure S4 for comparison of EGFR mutations in DNA and RNA and for a summary of EGFR rearrangements.
Figure 4
Figure 4. Landscape of Pathway Alterations in GBM
Alterations affecting canonical signal transduction and tumor suppressor pathways are summarized for 251 GBM with both exome sequencing and DNA copy number data. Rearrangements are underestimated in this summary since RNA-seq data were available for only a subset of cases with exome sequencing data (153/291, 61%). (A) Overall alteration rate is summarized for canonical PI3K/MAPK, p53 and Rb regulatory pathways. (B) Per-sample expansion of alterations summarized in 5A. Mutations (blue), focal amplifications (red) and homozygous deletions are selected from the patient-centric tables and organized by function. All missense, nonsense and frame-shift mutations are included. EGFRvIII is inferred from RNA data and included as a mutation if >=10% transcribed allelic frequency. Deletions are defined by log2 ratios < −1 or <−0.5 and focally targeting the gene (see Extended Experimental Procedures). Amplifications are defined by log2 ratio>2 or >1 and focal. (C) Left: For a cohort of 25 GBMs for which whole genome sequencing allowed genotyping, TERT promoter C228T and C250T mutations occurred in a mutually exclusive fashion. All four TERT promoter wildtype GBM harbored ATRX mutation, and were enriched in G-CIMP group. Right: TERT promoter mutations are associated with elevated expression.
Figure 5
Figure 5. Molecular subclasses of GBM and their genomic molecular correlates
(A) Genomic alterations and survival associated with five molecular subtypes of GBM. Expression and DNA methylation profiles were used to classify 332 GBMs with available (native DNA and whole genome amplified DNA) exome sequencing and DNA copy number levels. The most significant genomic associations were identified through Chi-square tests, with p-values corrected for multiple testing using the Benjamini-Hochberg method. (B) Genomic alterations and sample features associated with six GBM methylation clusters. Epigenomic consensus clustering was performed on 396 GBM samples profiled across two different platforms (Infinium HM27 and Infinium HM450). Six DNA methylation clusters were identified (see related SI Figure S5), represented as M1 to M6, where M5 is G-CIMP. These DNA methylation signatures are correlated with 27 selected features composed of clinical, somatic and copy number alterations; DM cluster, G-CIMP status, four TCGA GBM gene expression subclasses, two clinical features (Age at diagnosis/overall survival in months), somatic mutations (IDH1, TP53, ATRX) and 18 selected copy number alterations.
Figure 6
Figure 6
Canonical PI3K and MAPK pathway activation determined by reverse phase protein arrays and compared between GBM subclasses: Proneural (P, purple, n=55) and Mesenchymal (M, red, n=45). Activation/expression levels are plotted for principal signaling nodes of the MAPK (phospho-MEK and phospho-p90RSK), PI3 kinase (pS473-Akt) and mTOR (TSC1/2, phospho-mTOR, p235/236 S6, phospho-4EBP1 and EIF4E) pathways (p-values, two-tailed T-test). Mesenchymal tumors showed increased activation of the MAPK pathway (evidenced by higher levels of phospho-MEK and downstream phospho-p90RSK) and decreased levels of phospho-ERK inhibitory target TSC2. In contrast, proneural tumors showed relatively elevated expression and activation of members of the PI(3) kinase pathway including Akt PDK1 target site threonine 308 (p=0.01, not shown) and Akt mTORC2 target site (serine 473). Phospho-ERK levels were not significantly different between these two subtypes.

References

    1. Bady P, Sciuscio D, Diserens AC, Bloch J, van den Bent MJ, Marosi C, Dietrich PY, Weller M, Mariani L, Heppner FL, et al. MGMT methylation analysis of glioblastoma on the Infinium methylation BeadChip identifies two distinct CpG regions associated with gene silencing and outcome, yielding a prediction model for comparisons across datasets, tumor grades, and CIMP-status. Acta neuropathologica. 2012;124:547–560. - PMC - PubMed
    1. Bartel DP. MicroRNAs: genomics, biogenesis, mechanism, and function. Cell. 2004;116:281–297. - PubMed
    1. Berger MF, Hodis E, Heffernan TP, Deribe YL, Lawrence MS, Protopopov A, Ivanova E, Watson IR, Nickerson E, Ghosh P, et al. Melanoma genome sequencing reveals frequent PREX2 mutations. Nature. 2012;485:502–506. - PMC - PubMed
    1. Beroukhim R, Mermel CH, Porter D, Wei G, Raychaudhuri S, Donovan J, Barretina J, Boehm JS, Dobson J, Urashima M, et al. The landscape of somatic copy-number alteration across human cancers. Nature. 2010;463:899–905. - PMC - PubMed
    1. Brennan C, Momota H, Hambardzumyan D, Ozawa T, Tandon A, Pedraza A, Holland E. Glioblastoma subclasses can be defined by activity among signal transduction pathways and associated genomic alterations. PLoS One. 2009;4:e7752. - PMC - PubMed

Publication types

Grants and funding