

Prediction of age-related macular degeneration in the general population: the Three Continent AMD Consortium
- PMID: 24120328
- PMCID: PMC3986722
- DOI: 10.1016/j.ophtha.2013.07.053
Prediction of age-related macular degeneration in the general population: the Three Continent AMD Consortium
Erratum in
- Ophthalmology. 2014 Apr;121(4):976. Sivakumaran, Theru S [corrected to Sivakumaran, Theru A]
Abstract
Purpose: Prediction models for age-related macular degeneration (AMD) based on case-control studies have a tendency to overestimate risks. The aim of this study is to develop a prediction model for late AMD based on data from population-based studies.
Design: Three population-based studies: the Rotterdam Study (RS), the Beaver Dam Eye Study (BDES), and the Blue Mountains Eye Study (BMES) from the Three Continent AMD Consortium (3CC).
Participants: People (n = 10,106) with gradable fundus photographs, genotype data, and follow-up data without late AMD at baseline.
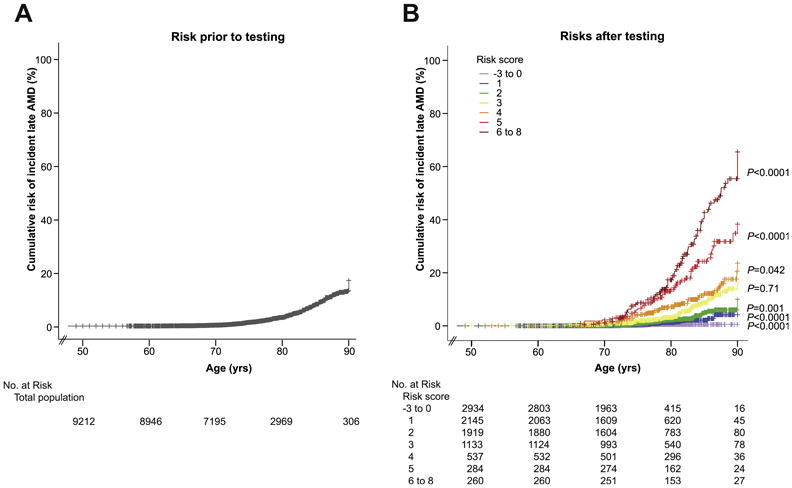
Methods: Features of AMD were graded on fundus photographs using the 3CC AMD severity scale. Associations with known genetic and environmental AMD risk factors were tested using Cox proportional hazard analysis. In the RS, the prediction of AMD was estimated for multivariate models by area under receiver operating characteristic curves (AUCs). The best model was validated in the BDES and BMES, and associations of variables were re-estimated in the pooled data set. Beta coefficients were used to construct a risk score, and risk of incident late AMD was calculated using Cox proportional hazard analysis. Cumulative incident risks were estimated using Kaplan-Meier product-limit analysis.
Main outcome measures: Incident late AMD determined per visit during a median follow-up period of 11.1 years with a total of 4 to 5 visits.
Results: Overall, 363 participants developed incident late AMD, 3378 participants developed early AMD, and 6365 participants remained free of any AMD. The highest AUC was achieved with a model including age, sex, 26 single nucleotide polymorphisms in AMD risk genes, smoking, body mass index, and baseline AMD phenotype. The AUC of this model was 0.88 in the RS, 0.85 in the BDES and BMES at validation, and 0.87 in the pooled analysis. Individuals with low-risk scores had a hazard ratio (HR) of 0.02 (95% confidence interval [CI], 0.01-0.04) to develop late AMD, and individuals with high-risk scores had an HR of 22.0 (95% CI, 15.2-31.8). Cumulative risk of incident late AMD ranged from virtually 0 to more than 65% for those with the highest risk scores.
Conclusions: Our prediction model is robust and distinguishes well between those who will develop late AMD and those who will not. Estimated risks were lower in these population-based studies than in previous case-control studies.
Copyright © 2013. Published by Elsevier Inc.
Figures

References
-
- Eye Diseases Prevalence Research Group. Causes and prevalence of visual impairment among adults in the United States. Arch Ophthalmol. 2004;122:477–85. - PubMed
-
- Klaver CC, Wolfs RC, Vingerling JR, et al. Age-specific prevalence and causes of blindness and visual impairment in an older population: the Rotterdam Study. Arch Ophthalmol. 1998;116:653–8. - PubMed
-
- Augood CA, Vingerling JR, de Jong PT, et al. Prevalence of age-related maculopathy in older Europeans: the European Eye Study (EUREYE) Arch Ophthalmol. 2006;124:529–35. - PubMed
-
- Fact Sheet no 282. World Health Organization; Nov, 2004. [Accessed July 28, 2013]. VISION 2020: The Right to Sight, the global initiative for the elimination of avoidable blindness: magnitude and causes of visual impairment. Available at: http://whqlibdoc.who.int/fact_sheet/2004/FS_282.pdf.
-
- van Leeuwen R, Klaver CC, Vingerling JR, et al. Epidemiology of age-related maculopathy: a review. Eur J Epidemiol. 2003;18:845–54. - PubMed
Publication types
MeSH terms
Grants and funding
LinkOut - more resources
Full Text Sources
Other Literature Sources
Medical
