. 2013 Nov 14;39(5):846-57.
doi: 10.1016/j.immuni.2013.08.036. Epub 2013 Oct 10.

A single peptide-major histocompatibility complex ligand triggers digital cytokine secretion in CD4(+) T cells

Affiliations

A single peptide-major histocompatibility complex ligand triggers digital cytokine secretion in CD4(+) T cells

Jun Huang et al. Immunity. .

Abstract

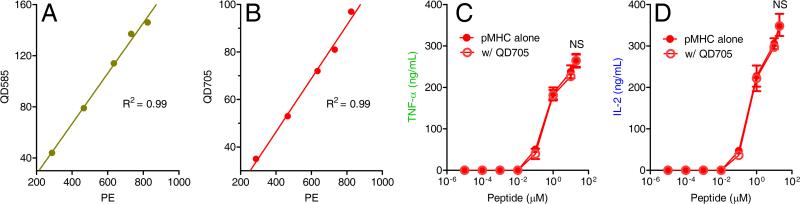
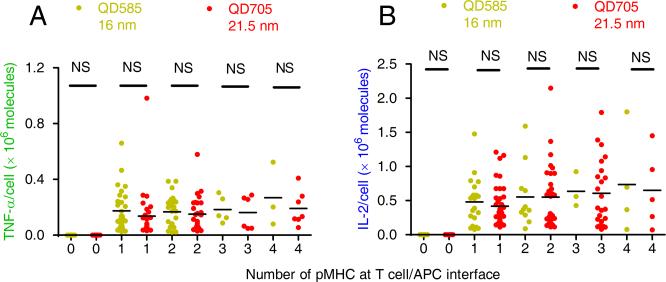
We have developed a single-molecule imaging technique that uses quantum-dot-labeled peptide-major histocompatibility complex (pMHC) ligands to study CD4(+) T cell functional sensitivity. We found that naive T cells, T cell blasts, and memory T cells could all be triggered by a single pMHC to secrete tumor necrosis factor-α (TNF-α) and interleukin-2 (IL-2) cytokines with a rate of ∼1,000, ∼10,000, and ∼10,000 molecules/min, respectively, and that additional pMHCs did not augment secretion, indicating a digital response pattern. We also found that a single pMHC localized to the immunological synapse induced the slow formation of a long-lasting T cell receptor (TCR) cluster, consistent with a serial engagement mechanism. These data show that scaling up CD4(+) T cell cytokine responses involves increasingly efficient T cell recruitment rather than greater cytokine production per cell.


Figures

Figure 1
Figure 1. Detection of specific pMHC complexes on the APC surface using quantum dot labeling
(A and B) Plots depict the mean fluorescence intensities (MFI) of MCC–I-Ek complexes on APCs as detected by PE-SA comparing QD585-SA (A) or QD705-SA (B) labeling using flow cytometry. (C and D) Dose response of TNF-α (C) and IL-2 (D) secretion measured by ELISA following 2-hour incubation of T cell blasts in response to APCs pulsed with a different concentrations of biotin-MCC peptide either labeled (open circles) or not labeled (filled circles) with QD705. No statistical differences (NS, t test) were found between labeled and unlabeled samples for TNF-α (C) and IL-2 (D) production in response to different concentrations of biotin-MCC peptide. Data are presented as mean ± SEM of three independent experiments (see also Figure S1).
Figure 2
Figure 2. A single pMHC stimulates T cell blasts to secrete cytokines
Shown are the DIC images of T cell-APC conjugates after 2 hours of incubation. TNF-α (A, shown as green) and IL-2 (B, shown as blue) secretion was detected by fluorescent antibody staining in response to a single pMHC presented at the T cell-APC interface as measured by 3D single-molecule fluorescence imaging. 3D reconstructions of the QD705-labeled pMHC fluorescence at the T cell-APC interface were viewed from the top of the T cell-APC contact sites (top view) or from the cell interfaces from the T cell looking at the APC (side view). The fluorescence signal along a line scan drawn through the cellular interface indicates the position of a single pMHC in the 3D reconstruction. The single peak proves the presence of a single pMHC and indicates its location (Xie et al., 2008). The fluorescence image of cytokine secretion (green for TNF-α and blue for IL-2) was overlaid with that of QD705 (red dot) at the focal plane to show the activation of a single T cell by a single pMHC. Scale bar (white), 5 μm. Data are representative of 115 independent measurements (see also Figure S2 and movie S1-S4).
Figure 3
Figure 3. Dose response of cytokine secretion by T cell blasts
Dose response of TNF-α (A) and IL-2 (B) cytokine secretion by T cell blasts in response to a low number of cognate pMHCs at the T cell-APC interface. pMHCs were labeled with either QD585 (yellow dots) or QD705 (red dots). No statistical differences (NS, t test) were found between QD585 and QD705 labeling for stimulating TNF-α (A) or IL-2 (B) production in response to different number of pMHCs. pMHC number was carefully defined using the single-molecule imaging technique. Cytokine secretion by single T cells was quantified using standard fluorescence beads (see Methods and Fig. S3 B-C). Each dot represents an individual measurement of pMHC number at the T cell-APC interface and the corresponding amount of secreted cytokine. The mean values are indicated by black dashes. Data are representative of 12 independent experiments (see also Figure S3).
Figure 4
Figure 4. A single pMHC stimulates naive and memory T cells to secrete cytokines
(A and B) Shown are the images of naive (A) and memory (B) T cell-APC conjugates after 6 hours and 3 hours incubation respectively. TNF-α (shown as green) and IL-2 (shown as blue) secretion was detected by fluorescent antibody staining in response to a single pMHC (yellow dot) present at the interface of T cell-APC conjugates measured by 3D single-molecule fluorescence imaging. A single pMHC labeled with QD585 was visualized at the T cell-APC interface at the overlaid images. (C and D) Normalized TNF-α (C) and IL-2 (D) cytokine secretion of naive T cells (cyan dots), T cell blasts (purple dots) and memory T cells (red dots) in response to different number of pMHCs at the T cell-APC interface. Scale bar (white), 5 μm. Each dot represents an individual measurement. The mean values are indicated as black dashes. Statistical significance of the differences between naive T cells and T cell blasts or memory T cells is shown (***, P < 0.0001; **, P < 0.01; *, P < 0.05; t-test) (see also Figure S4).
Figure 5
Figure 5. Digital cytokine secretion of T cells in response to a low number of pMHCs
(A and B) Naive T cells, T cell blasts, and memory T cells display a digital cytokine secretion pattern for TNF-α (A) and IL-2 (B) in response to a low number of pMHCs. Data in A and B are presented as mean ± SEM of 3 to 30 measurements. (C and D) The percentages of naive T cells, T cell blasts, and memory T cells secreting TNF-α or IL-2 following stimulation by a defined number of pMHCs at the T cell-APC interface are presented. 80 to 269 T cell-APC conjugates were analyzed for each condition. The arrow indicates the trend of percentage increase with increasing pMHC number. pMHCs were labeled with QD585 (see also Figure S5).
Figure 6
Figure 6. Kinetics of live cell cytokine secretion by T cell blasts and naive T cells in response to stimulation of a single pMHC
(A and B) Representative real-time cytokine secretions comparing a T cell blast and a naive T cell. The DIC signal was overlaid with cytokine fluorescence signal of TNF-α (A) and IL-2 (B). (C and D) The fluorescence signals were converted into the amounts of secreted cytokines and plotted against the time following the T cell-APC conjugate formation for T cell blasts and naive T cells. Cytokine release rates were obtained by fitting the data with a zero-order kinetics model for T cell blasts and naive T cells, and the goodness of fit were indicated by the R2 values. The slopes represent the rates of cytokine secretion of TNF-α, 18,000 (blast) and 2,400 (naive) molecules/min (C) and of IL-2, 23,000 (blast) and 1,600 (naive) molecules/min (D). (E) Comparison of cytokine release rates between T cell blasts and naive T cells. Data are presented as mean ± SEM of three independent measurements (see also Figure S6 and movie S5-S7).
Figure 7
Figure 7. A single pMHC triggers the formation of a sustained post-triggering TCR cluster
(A-C) Alexa488-H57 Fab-labeled 5C.C7 TCRs (green) interacting with a single pMHC labeled with QD705 (red) on APC surface at 30 (A), 60 (B) and 120 (C) minute incubation times. 3D fluorescence microscopy was used to detect single pMHCs and to visualize TCR cluster formation. The fluorescence images of pMHC were overlaid with those of TCR cluster or DIC images to demonstrate the co-localization between single pMHC and TCR cluster or the localization of pMHC at T cell-APC interface. Representative images of at least 30 cells for each incubation time as shown. (D) Quantification of the TCR number within individual cluster at different time-points. The intensities of individual clusters were measured within a 9 × 9 pixel square (2 μm2) surrounding each single pMHCs. TCR numbers were estimated based on the average value of the intensity of a single Alexa488-H57 Fab. Data are also presented as mean ± SEM (see also Figure S7).

Comment in

References

    1. Alakoskela JM, Koner AL, Rudnicka D, Kohler K, Howarth M, Davis DM. Mechanisms for size-dependent protein segregation at immune synapses assessed with molecular rulers. Biophys J. 2011;100:2865–2874. - PMC - PubMed
    1. Altan-Bonnet G, Germain RN. Modeling T cell antigen discrimination based on feedback control of digital ERK responses. PLoS Biol. 2005;3:e356. - PMC - PubMed
    1. Bhalla US, Iyengar R. Emergent properties of networks of biological signaling pathways. Science. 1999;283:381–387. - PubMed
    1. Bruniquel D, Schwartz RH. Selective, stable demethylation of the interleukin-2 gene enhances transcription by an active process. Nat Immunol. 2003;4:235–240. - PubMed
    1. Campi G, Varma R, Dustin ML. Actin and agonist MHC-peptide complex-dependent T cell receptor microclusters as scaffolds for signaling. J Exp Med. 2005;202:1031–1036. - PMC - PubMed

Publication types

MeSH terms