. 2013 Nov 22;288(47):33585-33597.
doi: 10.1074/jbc.M113.488098. Epub 2013 Oct 11.

In vivo epithelial wound repair requires mobilization of endogenous intracellular and extracellular calcium

Affiliations

In vivo epithelial wound repair requires mobilization of endogenous intracellular and extracellular calcium

Eitaro Aihara et al. J Biol Chem. .

Abstract

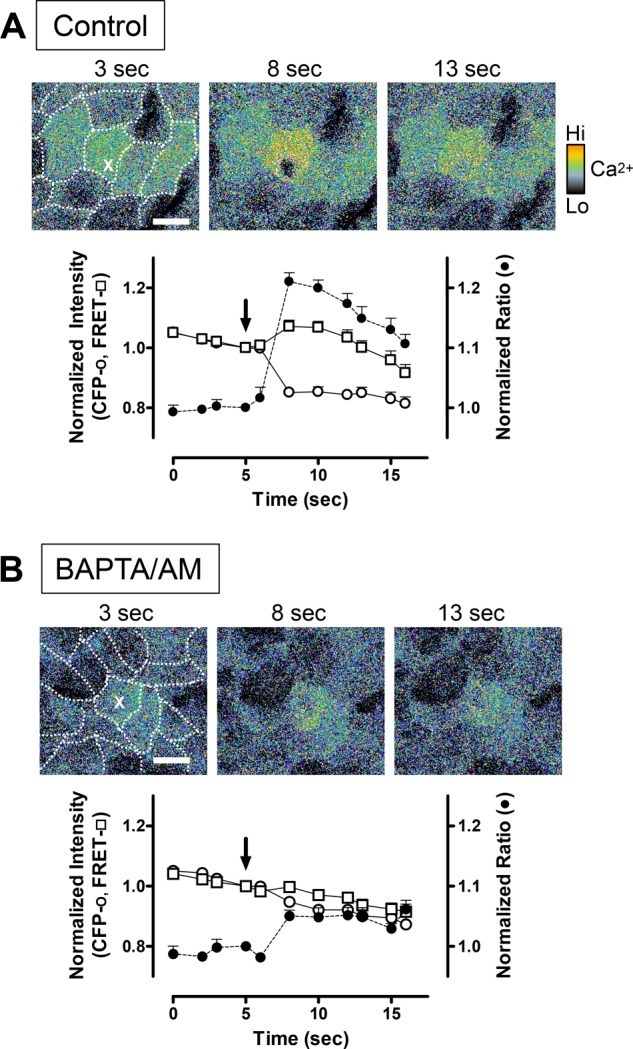
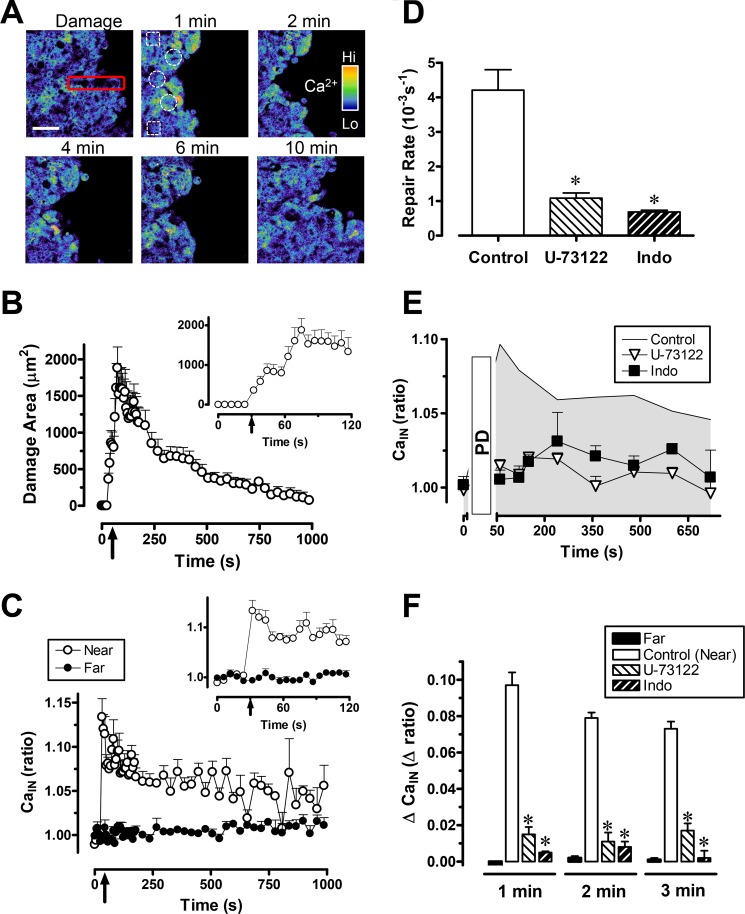
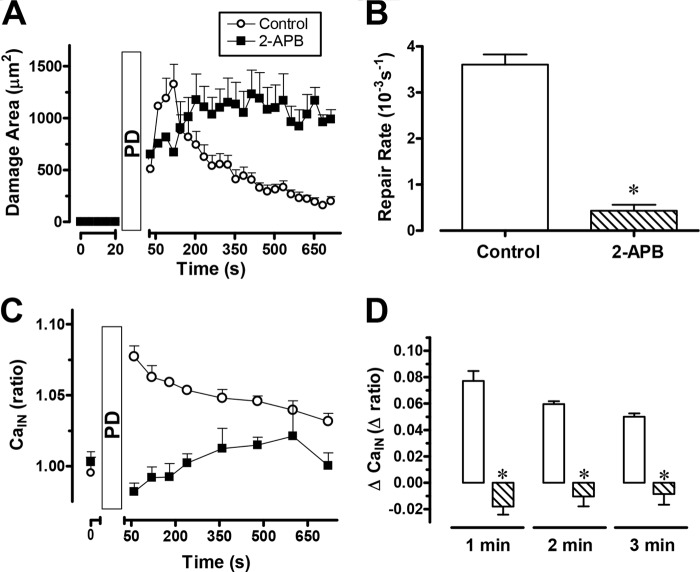
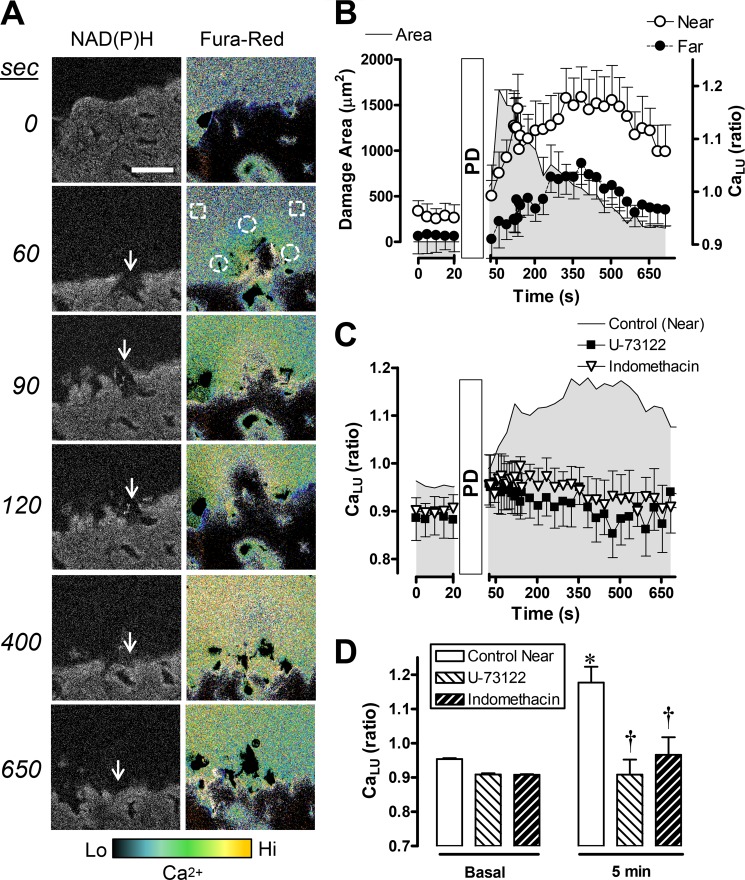
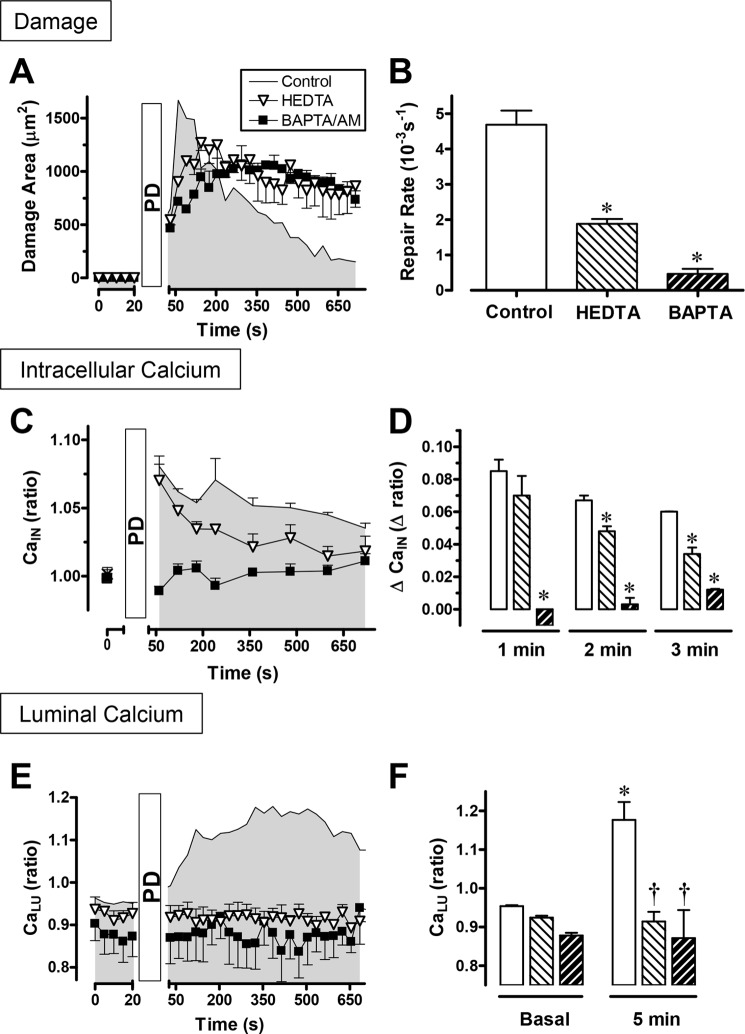
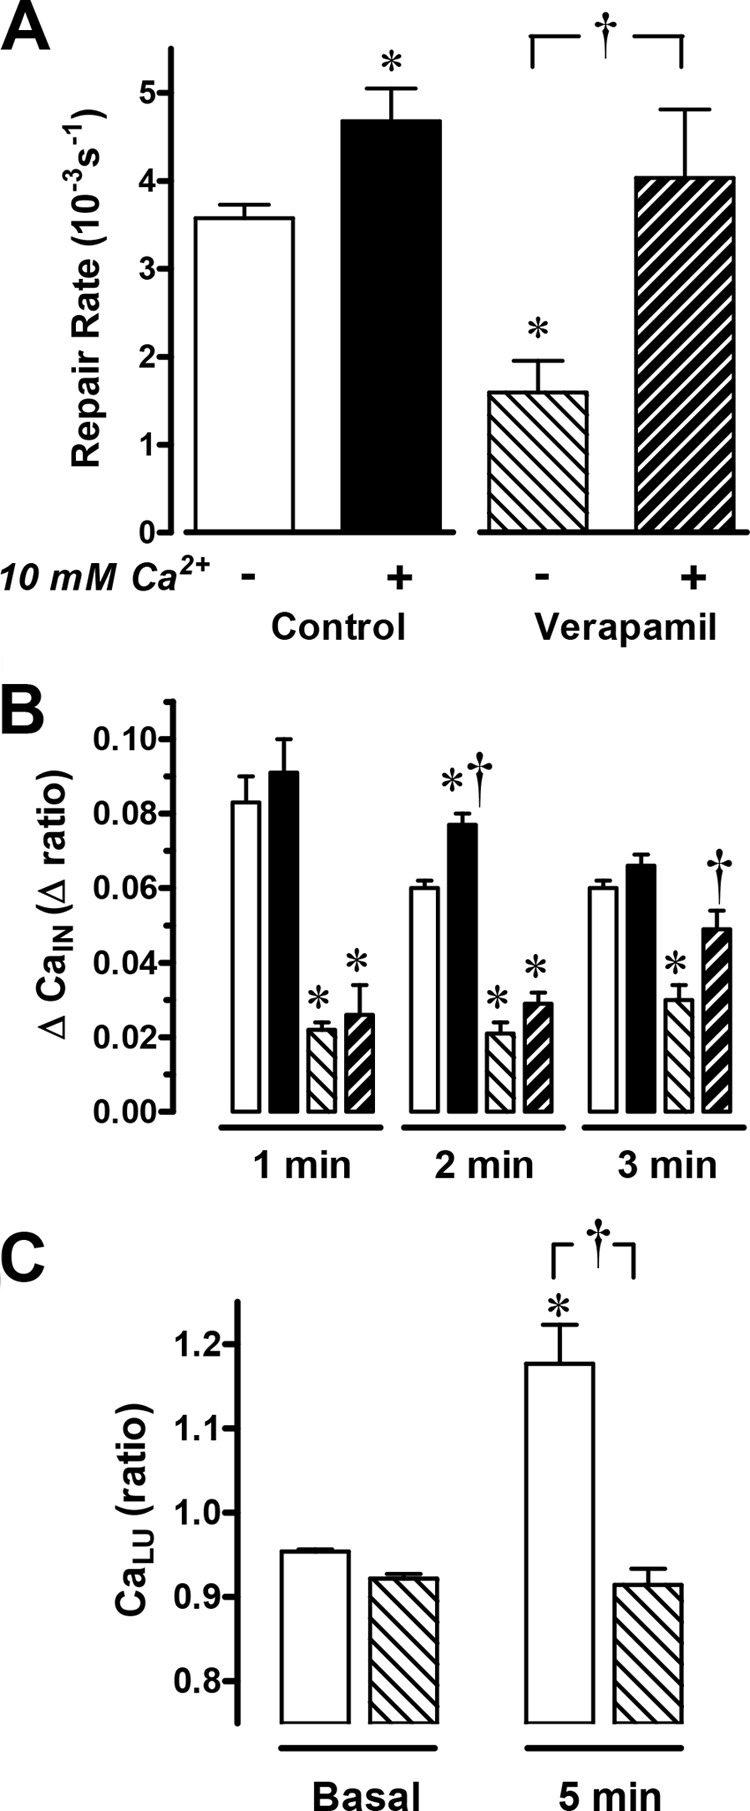
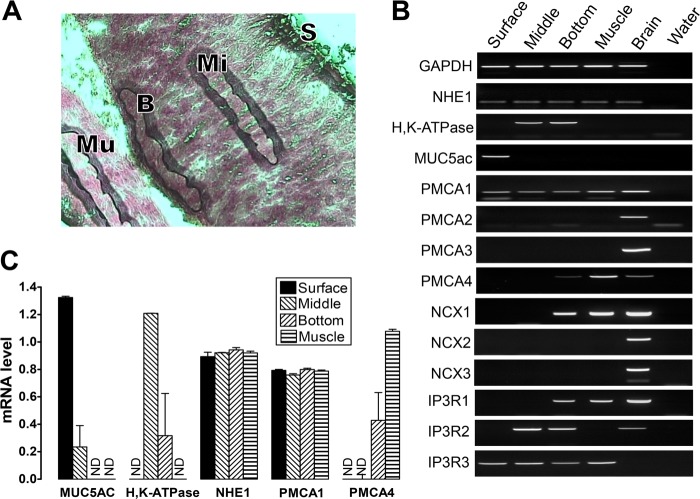
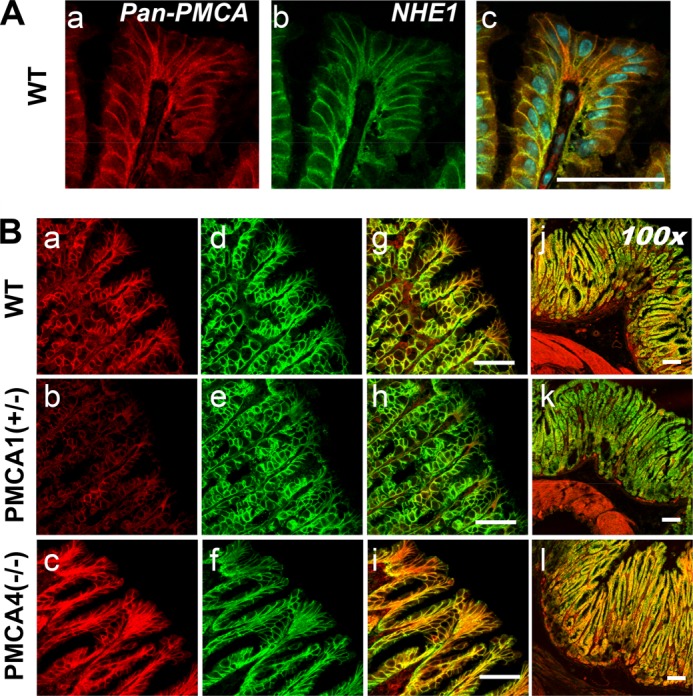
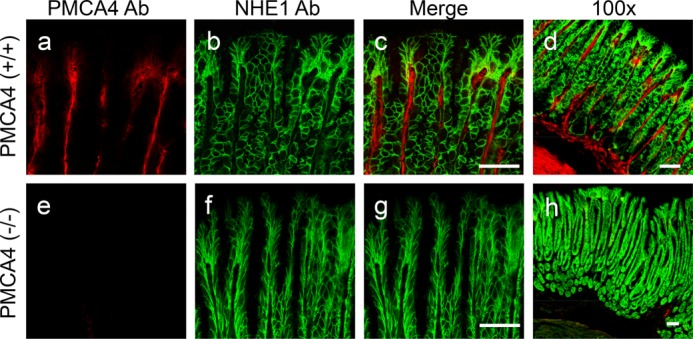
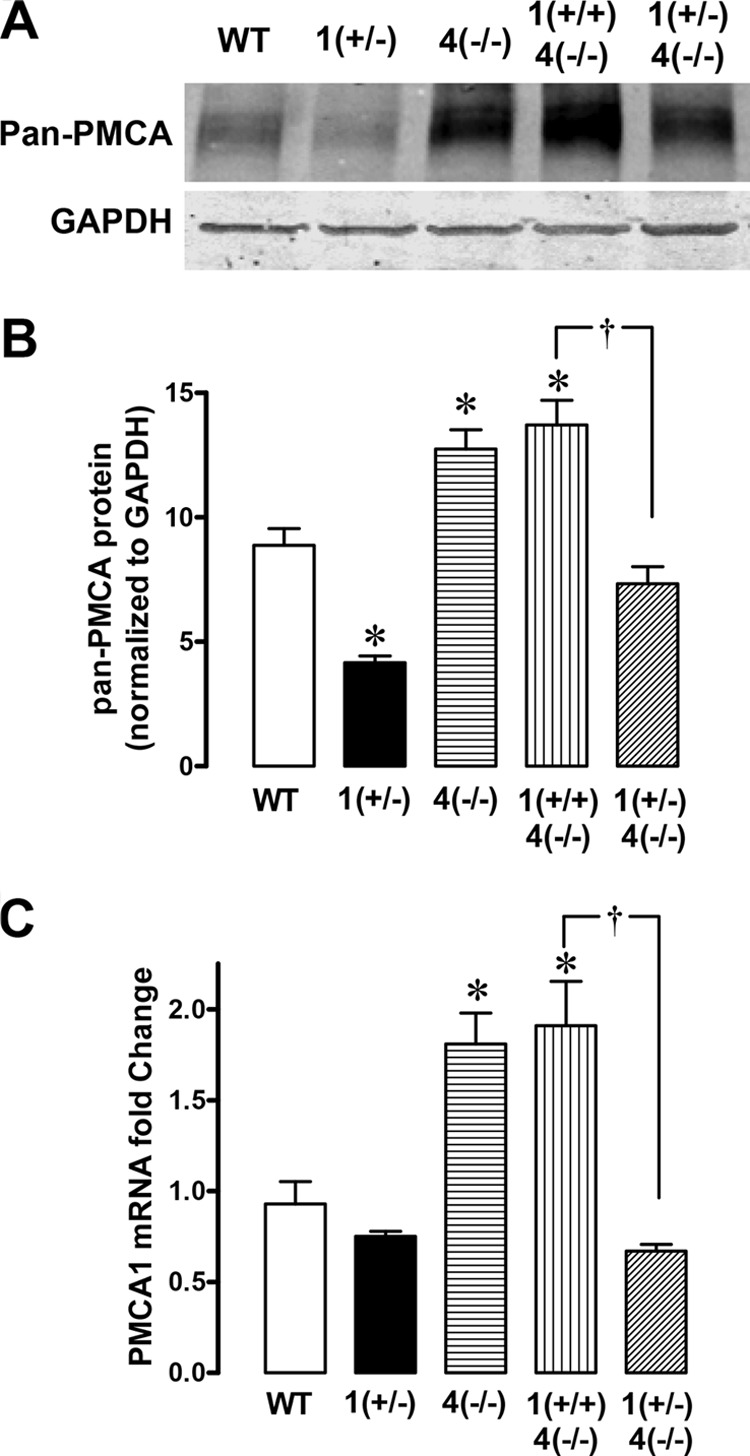
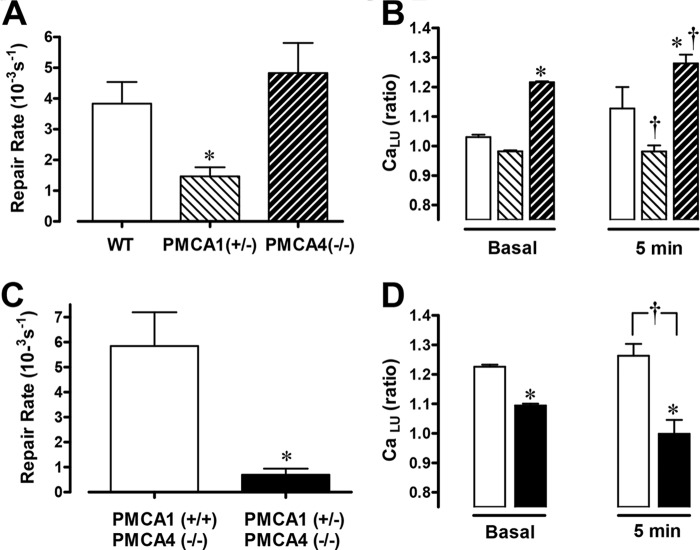
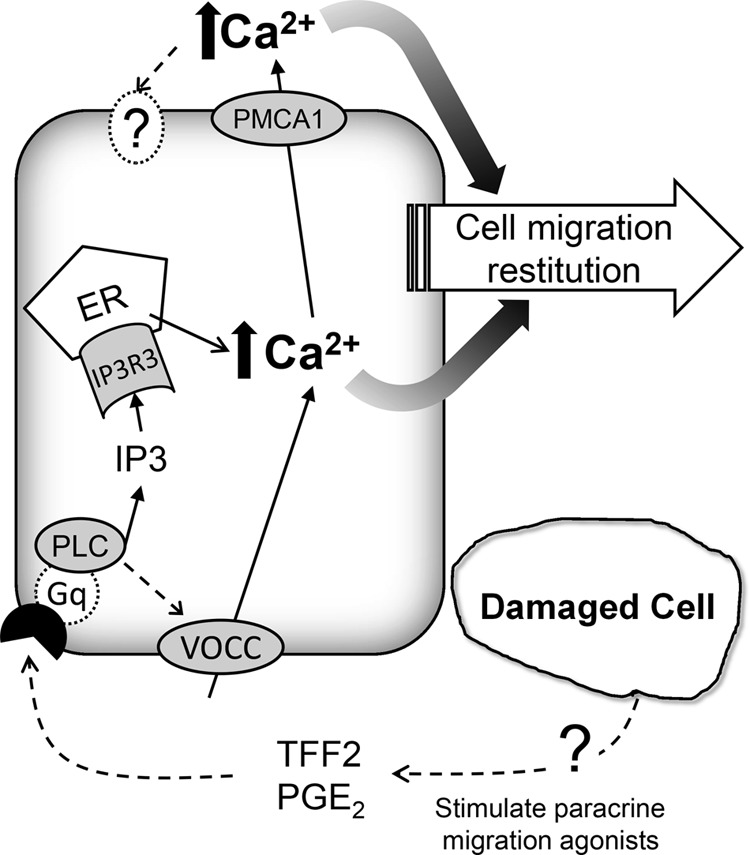
We report that a localized intracellular and extracellular Ca(2+) mobilization occurs at the site of microscopic epithelial damage in vivo and is required to mediate tissue repair. Intravital confocal/two-photon microscopy continuously imaged the surgically exposed stomach mucosa of anesthetized mice while photodamage of gastric epithelial surface cells created a microscopic lesion that healed within 15 min. Transgenic mice with an intracellular Ca(2+)-sensitive protein (yellow cameleon 3.0) report that intracellular Ca(2+) selectively increases in restituting gastric epithelial cells adjacent to the damaged cells. Pretreatment with U-73122, indomethacin, 2-aminoethoxydiphenylborane, or verapamil inhibits repair of the damage and also inhibits the intracellular Ca(2+) increase. Confocal imaging of Fura-Red dye in luminal superfusate shows a localized extracellular Ca(2+) increase at the gastric surface adjacent to the damage that temporally follows intracellular Ca(2+) mobilization. Indomethacin and verapamil also inhibit the luminal Ca(2+) increase. Intracellular Ca(2+) chelation (1,2-bis(o-aminophenoxy)ethane-N,N,N',N'-tetraacetic acid/acetoxymethyl ester, BAPTA/AM) fully inhibits intracellular and luminal Ca(2+) increases, whereas luminal calcium chelation (N-(2-hydroxyetheyl)-ethylendiamin-N,N,N'-triacetic acid trisodium, HEDTA) blocks the increase of luminal Ca(2+) and unevenly inhibits late-phase intracellular Ca(2+) mobilization. Both modes of Ca(2+) chelation slow gastric repair. In plasma membrane Ca-ATPase 1(+/-) mice, but not plasma membrane Ca-ATPase 4(-/-) mice, there is slowed epithelial repair and a diminished gastric surface Ca(2+) increase. We conclude that endogenous Ca(2+), mobilized by signaling pathways and transmembrane Ca(2+) transport, causes increased Ca(2+) levels at the epithelial damage site that are essential to gastric epithelial cell restitution in vivo.

Keywords: Calcium; Calcium Imaging; Calcium Signaling; Cell Migration; Fluorescence Resonance Energy Transfer (FRET); Fura Red; Photodamage; Two-photon Microscopy; Yellow Cameleon.


Figures

FIGURE 1.
FIGURE 1.
Using YC3.0 transgenic mice to detect calcium mobilization by two-photon FRET after damage to single gastric surface epithelial cells. Shown are a representative time course of images and two-photon fluorescence data collected in control conditions (A, n = 7) or after 250 μm BAPTA/AM incubation (B, n = 9). Pseudocolor FRET/CFP ratio images were collected at the indicated times, with damage imposed at 5 s. The first image in each series has an overlay showing the outlines of individual gastric surface epithelial cells. A single cell in the image was stimulated at 5 s by high-power, two-photon light at a single pixel (X). Scale bars = 10 μm. Shown are fluorescence intensity values (mean ± S.E.) extracted from the damaged cell and normalized to values before imposing photodamage (arrows) of CFP (○) and FRET fluorescence (□) as well as calculated FRET/CFP ratio values (●).
FIGURE 2.
FIGURE 2.
Gastric surface repair and intracellular calcium (CaIN) mobilization after photodamage. Experiments were performed using YC transgenic mice. U-73122or indomethacin (Indo) was applied 1 h before PD. Averaged results are mean ± S.E., *, p < 0.05 versus control. A, pseudocolor FRET/CFP ratio images (2 × 2 median-filtered) collected at the indicated times from a representative time course experiment. Gastric surface cells were photodamaged (red rectangle) at time zero. Measurements were made in viable cells adjacent to the damaged area (near, white circles) or in viable cells 100 μm from damage area (far, white squares). Scale bar = 50 μm. B, the time course of damage size observed after inducing PD at the indicated time (arrow). The inset shows the expanded time scale. Values are mean ± S.E. (n = 6 mice). C, the FRET/CFP ratio was measured in viable near or far cells as indicated. The time of PD is indicated by the arrow. The inset shows the expanded time scale. n = 6 mice. D, exponential curve fits to results such as those in B were used to measure rates of repair, as described under “Experimental Procedures.” Resulting rate constants are presented in the absence of drugs (control, n = 6) or in the presence of U-73122 (n = 5) or indomethacin (n = 5). E, using the animals evaluated in D, the FRET/CFP ratio was calculated from cells adjacent to damage in the absence or presence of drugs as indicated. F, results showing the calculated difference between the FRET/CFP ratio at time zero and the indicated time point. Results are shown for the absence of drug (near and far cells as defined above, n = 6), or near cells in the presence of U-73122 (n = 5) or indomethacin (n = 5).
FIGURE 3.
FIGURE 3.
Effects of 2-APB on gastric surface repair. Compiled results (mean ± S.E.) with YC transgenic mice (control, n = 5; 2-APB, n = 4) showing the time course of the damaged area (A), which was used to derive the calculated repair rate (B). Under the same conditions, the FRET/CFP ratio (CaIN) (C) was calculated from cells adjacent to the damage (C) or as the difference calculated between the FRET/CFP ratio at time zero and the indicated time point (D). *, p < 0.05 versus control.
FIGURE 4.
FIGURE 4.
Extracellular Ca2+ (CaLU) mobilization adjacent to gastric surface damage. Experiments were performed using C57Bl/6 mice. A, representative experiment with PD imposed directly after time zero (at the site shown by the arrows), and NAD(P)H autofluorescence and Fura-Red F458/F488 ratio images were collected at the indicated times. Calcium levels in the ratio images are pseudocolored according to the color bar. Scale bar = 50 μm. B, time course of the measured damage area (left y axis scale) and F458/F488 ratio (CaLU), right y axis scale) measured in the luminal space directly adjacent (< 50 μm) from the PD site (Near, white circles in A) or > 100 μm from the damage site (Far, white squares in A). Values are mean ± S.E. n = 6. The time course of the F458/F488 ratio (CaLU) (C) and values directly prior to damage (Basal) and 5 min after damage (D) are shown in the absence of drug (n = 6) or the presence of U-73122 (n = 7) or indomethacin (n = 4) as applied in Fig. 2. *, p < 0.05 versus basal control; †, p < 0.05 versus control at 5 min.
FIGURE 5.
FIGURE 5.
Effects of calcium chelation on gastric surface repair and calcium mobilization. Experiments tested the effects of luminal HEDTA (▿ or light hatched bar) or BAPTA/AM (■ or dark hatched bar) on the response to PD compared with the absence of drug (control). Compiled results (mean ± S.E.) with YC transgenic mice (control, n = 4; HEDTA, n = 4; BAPTA/AM, n = 4) showing the time course of damaged area (A), which was used to derive the calculated repair rate (B). Under the same conditions, the FRET/CFP ratio (CaIN) (C) was calculated from cells adjacent to the damage, and the difference was calculated between the FRET/CFP ratio at time zero and the indicated time point (D). Using C57Bl/6 mice and Fura-Red in luminal perfusates (control, n = 6; HEDTA, n = 4; BAPTA/AM, n = 5), the time course of the F458/F488 ratio (CaLU) (E) and values directly prior to damage (basal) and 5 min after damage (F) are shown. *, p < 0.05 versus control; †, p < 0.05 versus control at 5 min. The symbols in C and E are the same as in A, whereas in D and F they are the same as in B.
FIGURE 6.
FIGURE 6.
The effects of verapamil on gastric surface repair. Verapamil was given 1 h before PD was applied at time zero. The gastric mucosa were superfused either with conventional perfusate solution with no added Ca2+ (control, n = 6; verapamil, n = 8) or with a solution containing 10 mm Ca2+ (control, n = 4; verapamil, n = 6). A, compiled results from YC transgenic mice show the calculated repair rate (*, p < 0.05 versus no Ca2+ control; †, p < 0.05 versus absence of verapamil). B, the change in FRET/CFP ratio (ΔCaIN) calculated from cells adjacent to damage where the basal ratio value before damage is subtracted from the ratio at the indicated time point (*, p < 0.05 versus time control. †, p < 0.05 versus absence of verapamil) (B). C, using C57Bl/6 mice and Fura-Red in luminal perfusates (n = 6), F458/F488 ratio values before (basal) and 5 min after PD. *, p < 0.05 versus basal control; †, p < 0.05 versus control at 5 min. The symbols in B and C are the same as in A.
FIGURE 7.
FIGURE 7.
Site-specific expression of mRNA for PMCA, NCX, and IP3 receptor isoforms in stomach tissue. Laser capture microdissection collected four stomach regions: surface epithelium (S, < 10 μm from the lumen), middle (Mi, midway through the glandular region), bottom (B, < 50 μm from the base of gastric glands), and muscle (Mu). A, image showing the four gastric regions collected. B, conventional PCR and agarose gel separation evaluated 14 genes as indicated. The brain section was the positive control, and no cDNA (water) was a negative control. [single dagger symbol]. C, real-time PCR was performed to compare the expression levels among the four gastric regions. Data were normalized to GAPDH expression using ΔΔCT calculations. Data are mean ± S.E., n = 3. ND, no detection.
FIGURE 8.
FIGURE 8.
PMCA localization in mice with selective PMCA isoform knockout. A, C57Bl/6 mouse stomach stained with primary antibodies that recognize all PMCA isoforms (a), NHE1 (b), or a merged image with nuclei stain (c). B, WT, PMCA1+/−, or PMCA4−/− mouse stomach reacted with primary antibodies that recognize all PMCA isoforms (a–c) or NHE1 (d–f). These images were merged to compare labeling patterns (g–i) and were compared with a lower-magnification merged image that shows muscle layers (j–l). Scale bars = 50 μm.
FIGURE 9.
FIGURE 9.
PMCA4 localization in mouse stomach. The WT or PMCA4−/− mouse stomach was reacted with primary antibodies for PMCA4 (a and e) or NHE1 (b and f). These images were merged to compare labeling patterns (c and g) and were also compared with a lower-magnification merged image that shows muscle layers (d and h). Scale bars = 50 μm.
FIGURE 10.
FIGURE 10.
PMCA protein and mRNA levels in mice with selective PMCA isoform knockout. A, representative Western blot analysis comparing extracts from gastric mucosal scrapings (30 μg). The PMCA protein band was ∼140 kDa, and GAPDH was ∼37 kDa. B, results compiling densitometry evaluation of the PMCA band normalized to GAPDH. Data are mean ± S.E., n = 4 mice. *, p < 0.05 versus WT. †, p < 0.05 versus PMCA1+/−/PMCA4−/−. C, real-time PCR was performed to compare PMCA1 mRNA expression levels in extracts from gastric mucosal scrapings. Data were normalized to wild-type whole stomach (including muscle) PMCA1 expression using ΔΔCT calculations. Data are mean ± S.E., n = 4–6. *, p < 0.05 versus WT. †, p < 0.05 versus PMCA1+/+/PMCA4−/−.
FIGURE 11.
FIGURE 11.
The effect of PMCA gene deletion on gastric surface repair and luminal Ca2+ mobilization. Experiments with WT (n = 5), PMCA1 +/− (n = 8), or PMCA4−/− (n = 6) mice using luminal Fura-Red to report juxtamucosal Ca2+ levels. Compiled results show the calculated repair rate (A) and Fura-Red F458/F488 ratio values before (basal) and 5 min after photodamage (B). Data are mean ± S.E. *, p < 0.05 versus WT basal; †, p < 0.05 versus WT at 5 min. Experiments were performed using PMCA1+/+/PMCA4−/− (n = 5), or PMCA1+/−)/PMCA4−/− (n = 5) mice. Compiled results (mean ± S.E.) are shown. C, calculated repair rate. *, p < 0.05 versus PMCA1+/+/PMCA4−/−. D, F458/F488 values before (basal) and after (5 min) PD. The symbols in D are the same as in C. *, p < 0.05 versus PMCA1+/+/PMCA4−/− basal; †, p < 0.05 versus PMCA1+/+/PMCA4−/− at 5 min.
FIGURE 12.
FIGURE 12.
Schematic of calcium mobilization in response to two-photon damage. Dotted lines indicate more speculative pathways. VOCC, voltage operated Ca2+ channel; TFF2, trefoil factor 2; PGE2, prostaglandin E2; PLC, phospholipase C; ER, endoplasmic reticulum; IP3R3, IP3 receptor isoform 3; PMCA1, plasma membrane Ca-ATPase isoform 1.

References

    1. Belkacemi L., Bédard I., Simoneau L., Lafond J. (2005) Calcium channels, transporters and exchangers in placenta. A review. Cell Calcium 37, 1–8 - PubMed
    1. Hofer A. M. (2005) Another dimension to calcium signaling. A look at extracellular calcium. J. Cell Sci. 118, 855–862 - PubMed
    1. Demitrack E. S., Soleimani M., Montrose M. H. (2010) Damage to the gastric epithelium activates cellular bicarbonate secretion via SLC26A9 Cl/HCO3. Am. J. Physiol. Gastrointest. Liver Physiol. 299, G255–264 - PMC - PubMed
    1. Critchlow J., Magee D., Ito S., Takeuchi K., Silen W. (1985) Requirements for restitution of the surface epithelium of frog stomach after mucosal injury. Gastroenterology 88, 237–249 - PubMed
    1. Cheng A. M., Morrison S. W., Yang D. X., Hagen S. J. (2001) Energy dependence of restitution in the gastric mucosa. Am. J. Physiol. Cell Physiol. 281, C430–438 - PubMed

Publication types

MeSH terms

Substances