

A comparison of 12 algorithms for matching on the propensity score
- PMID: 24123228
- PMCID: PMC4285163
- DOI: 10.1002/sim.6004
A comparison of 12 algorithms for matching on the propensity score
Abstract
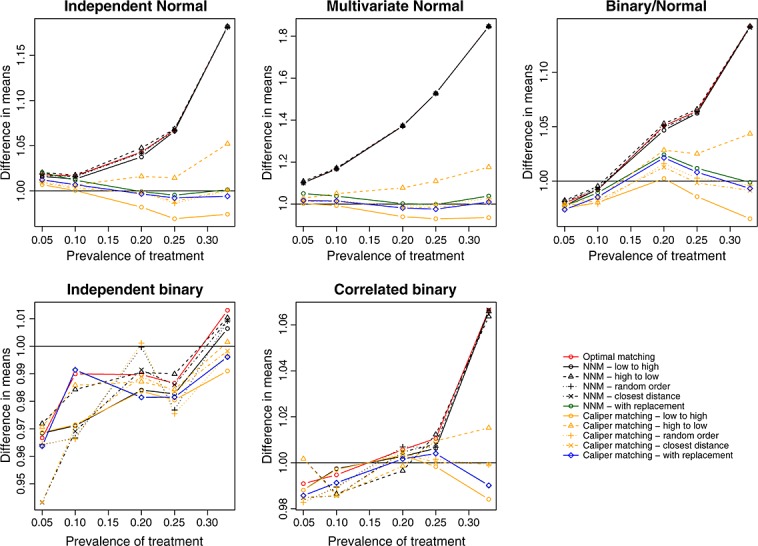
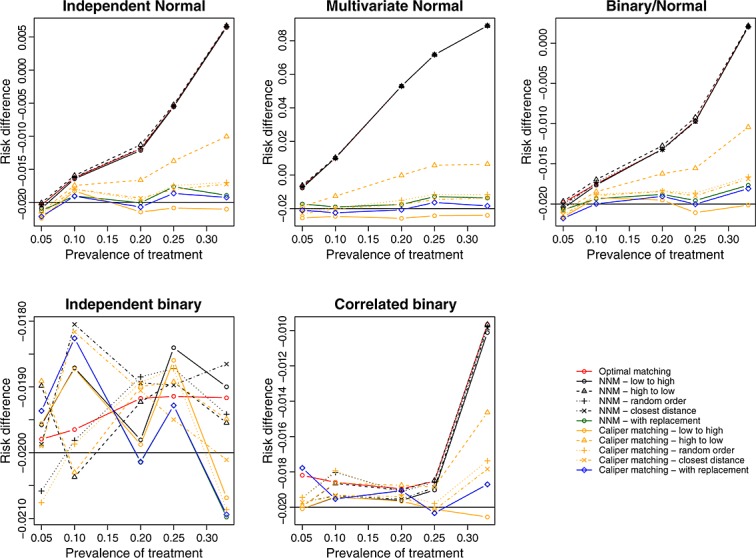
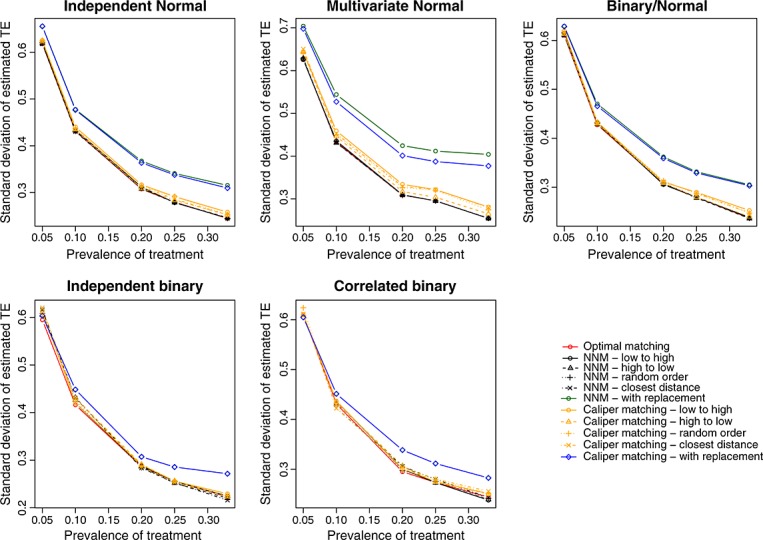
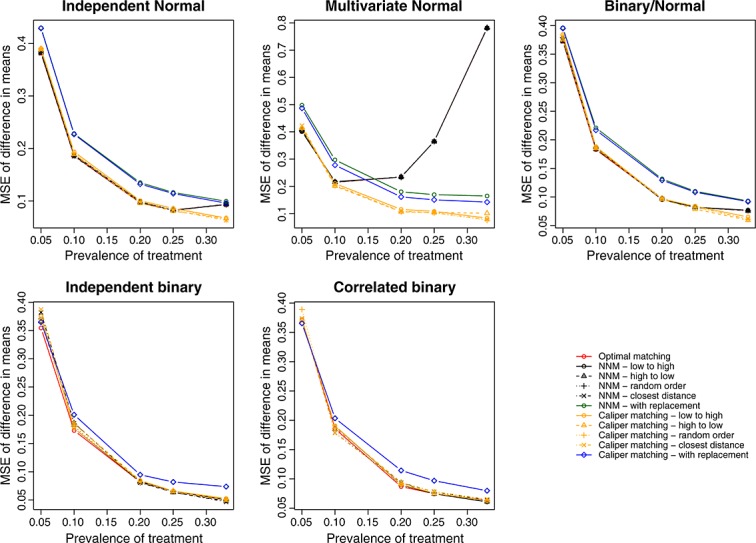
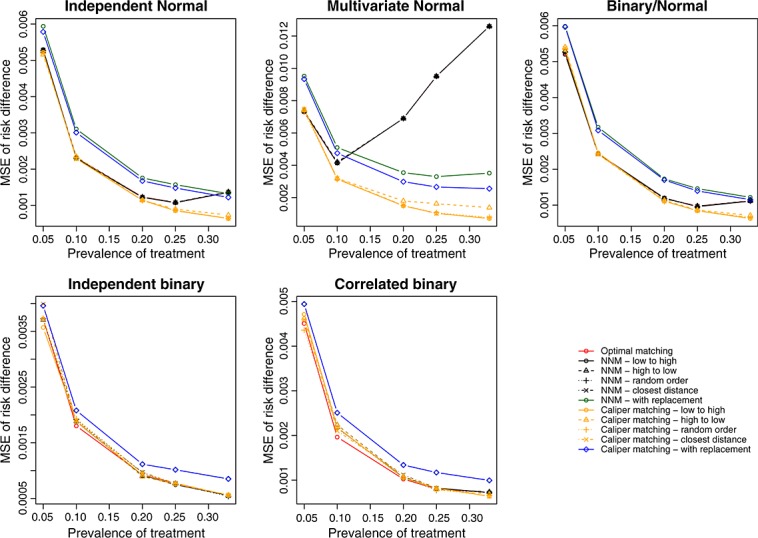
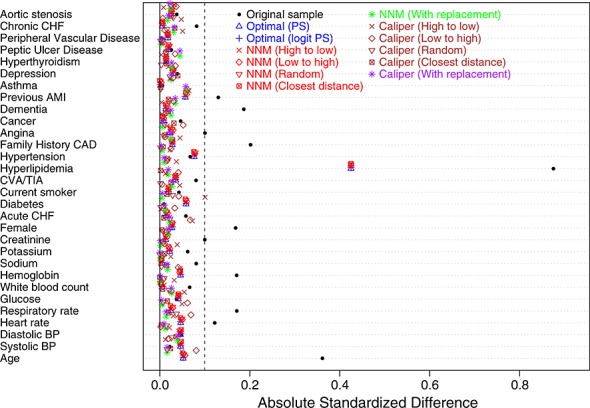
Propensity-score matching is increasingly being used to reduce the confounding that can occur in observational studies examining the effects of treatments or interventions on outcomes. We used Monte Carlo simulations to examine the following algorithms for forming matched pairs of treated and untreated subjects: optimal matching, greedy nearest neighbor matching without replacement, and greedy nearest neighbor matching without replacement within specified caliper widths. For each of the latter two algorithms, we examined four different sub-algorithms defined by the order in which treated subjects were selected for matching to an untreated subject: lowest to highest propensity score, highest to lowest propensity score, best match first, and random order. We also examined matching with replacement. We found that (i) nearest neighbor matching induced the same balance in baseline covariates as did optimal matching; (ii) when at least some of the covariates were continuous, caliper matching tended to induce balance on baseline covariates that was at least as good as the other algorithms; (iii) caliper matching tended to result in estimates of treatment effect with less bias compared with optimal and nearest neighbor matching; (iv) optimal and nearest neighbor matching resulted in estimates of treatment effect with negligibly less variability than did caliper matching; (v) caliper matching had amongst the best performance when assessed using mean squared error; (vi) the order in which treated subjects were selected for matching had at most a modest effect on estimation; and (vii) matching with replacement did not have superior performance compared with caliper matching without replacement.
Keywords: Monte Carlo simulations; computer algorithms; matching; optimal matching; propensity score; propensity-score matching.
© 2013 The Authors. Statistics in Medicine published by John Wiley & Sons, Ltd.
Figures

References
-
- Rosenbaum PR, Rubin DB. The central role of the propensity score in observational studies for causal effects. Biometrika. 1983;70:41–55.
-
- Rosenbaum PR. Model-based direct adjustment. Journal of the American Statistical Association. 1987;82:387–394.
-
- Austin PC. Propensity-score matching in the cardiovascular surgery literature from 2004 to 2006: a systematic review and suggestions for improvement. Journal of Thoracic and Cardiovascular Surgery. 2007;134(5):1128–1135. - PubMed
-
- Austin PC. A critical appraisal of propensity-score matching in the medical literature between 1996 and 2003. Statistics in Medicine. 2008;27(12):2037–2049. - PubMed
-
- Thoemmes FJ, Kim ES. A systematic review of propensity score methods in the social sciences. Multivariate Behavioral Research. 2011;46(1):90–118. - PubMed
Publication types
MeSH terms
Substances
Grants and funding
LinkOut - more resources
Full Text Sources
Other Literature Sources
