Review
. 2013 Dec;26(12):1609-29.
doi: 10.1002/nbm.3025. Epub 2013 Oct 3.

Quantitative proton MR techniques for measuring fat

Affiliations
Review

Quantitative proton MR techniques for measuring fat

H H Hu et al. NMR Biomed. 2013 Dec.

Abstract

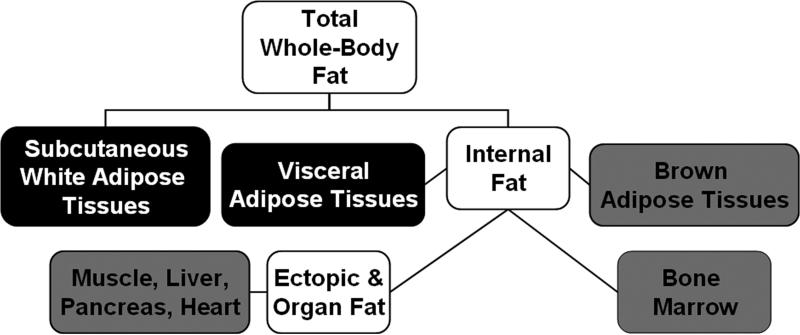
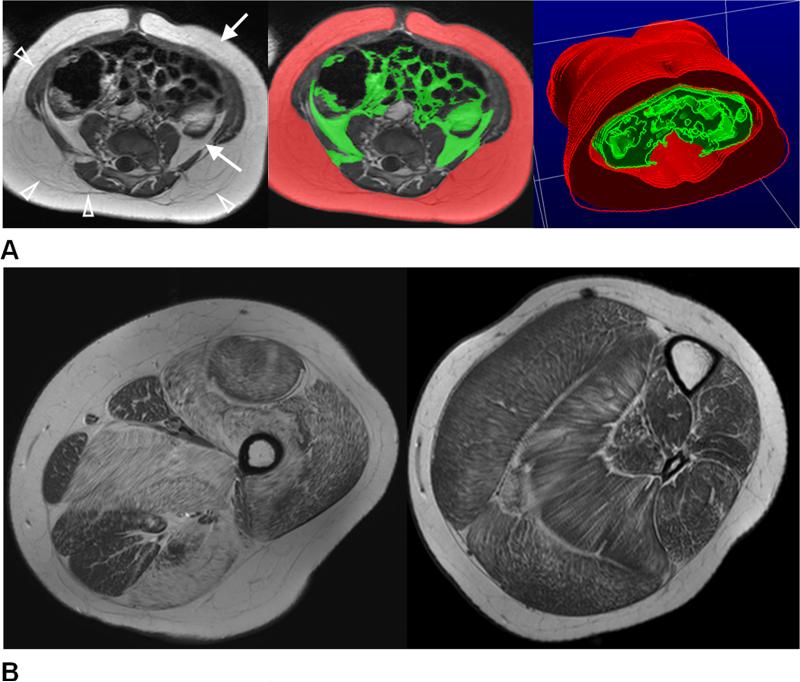
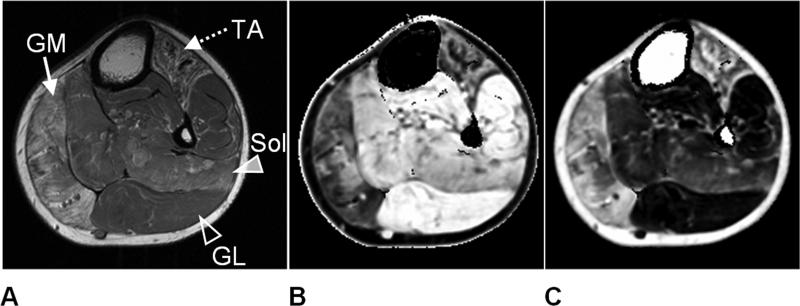
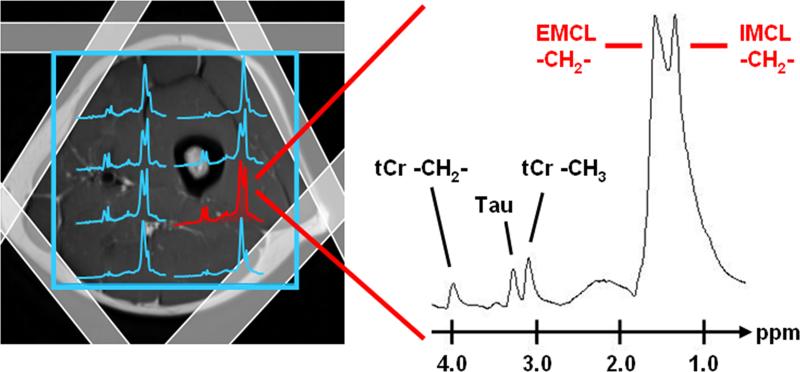
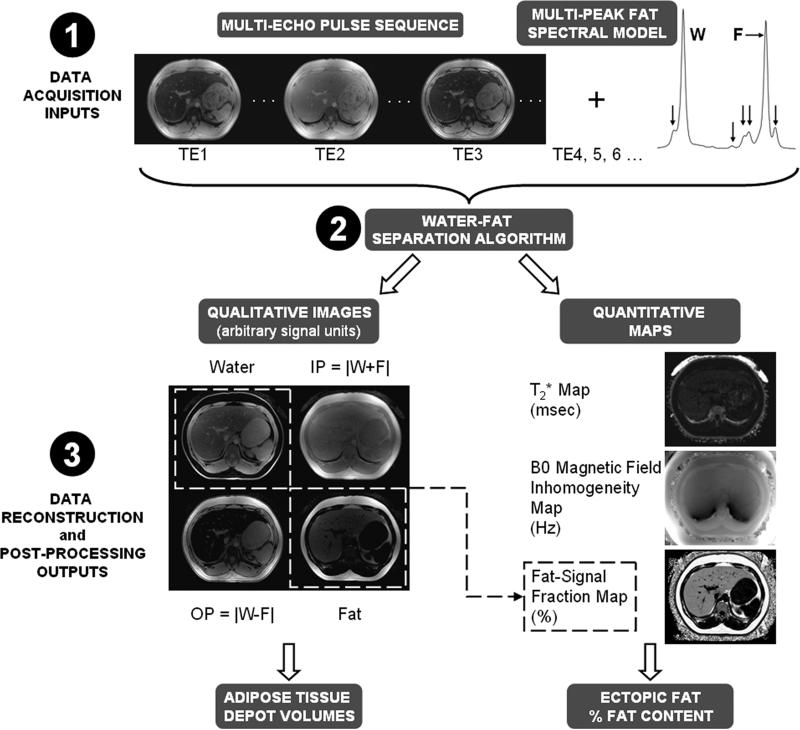
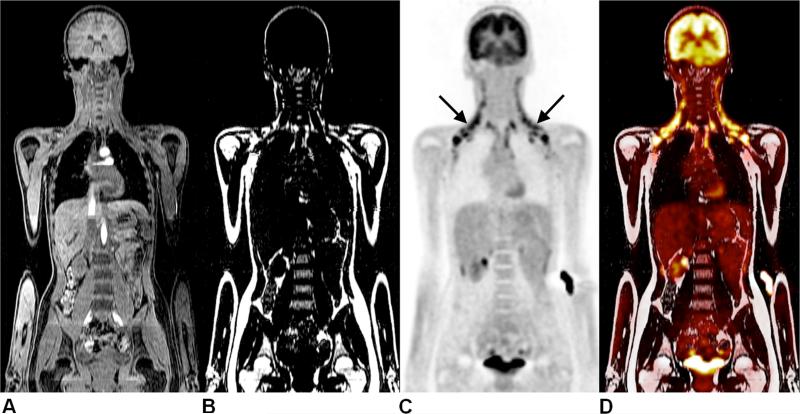
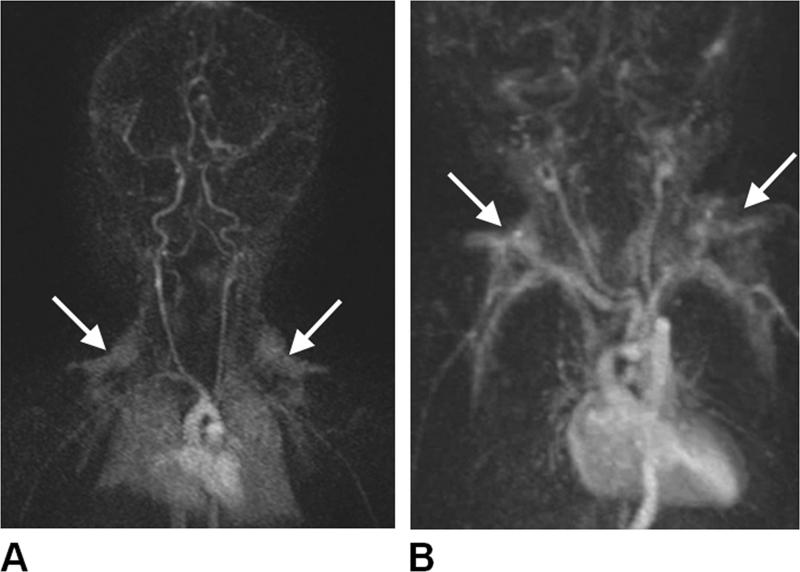
Accurate, precise and reliable techniques for the quantification of body and organ fat distributions are important tools in physiology research. They are critically needed in studies of obesity and diseases involving excess fat accumulation. Proton MR methods address this need by providing an array of relaxometry-based (T1, T2) and chemical shift-based approaches. These techniques can generate informative visualizations of regional and whole-body fat distributions, yield measurements of fat volumes within specific body depots and quantify fat accumulation in abdominal organs and muscles. MR methods are commonly used to investigate the role of fat in nutrition and metabolism, to measure the efficacy of short- and long-term dietary and exercise interventions, to study the implications of fat in organ steatosis and muscular dystrophies and to elucidate pathophysiological mechanisms in the context of obesity and its comorbidities. The purpose of this review is to provide a summary of mainstream MR strategies for fat quantification. The article succinctly describes the principles that differentiate water and fat proton signals, summarizes the advantages and limitations of various techniques and offers a few illustrative examples. The article also highlights recent efforts in the MR of brown adipose tissue and concludes by briefly discussing some future research directions.

Keywords: chemical shift; ectopic fat; fat quantification; muscle; obesity; spectroscopy; water-fat MRI; white and brown adipose tissue.


Figures

Figure 1
Figure 1
Classification of body fat locations commonly quantified by MR and reported in literature. Elements in black are white adipose tissue depots, and are typically quantified in units of volume (ml, L) or subsequently converted to mass (g, kg). They are measured via imaging pulse sequences. Grey elements are locations where fat exists diffusely and heterogeneously, whether naturally or abnormally. The typical quantitative endpoint here is a percent fat content, which can be derived with MR imaging and spectroscopy pulse sequences. One common measure is the fat-signal fraction (e.g. the ratio of fat signal to the sum of water and fat signals). Spectroscopy can also be used to characterize triglyceride properties at all locations, yielding information such as chain length and unsaturation levels.
Figure 2
Figure 2
(A) An example of axial T1-weighted image in the abdomen. Higher signal intensities of adipose tissue (arrows) in contrast to darker muscles and organs can be clearly seen. Arrowheads denote the thin fascia that divides the deep and superficial subcutaneous adipose tissue layers. The native data from these scans are typically contiguous multi-slice or three-dimensional with high spatial resolution, permitting post-processing and rendering procedures to further visualize subcutaneous (red) and visceral (green) distributions. Illustration courtesy of Wei Shen, M.D., St. Luke-Roosevelt Hospital and Columbia University, using sliceOmatic (Tomovision, Inc.) software. (B) Axial T1-weighted images in the upper and lower left leg of a 9-year-old boy with Duchenne muscular dystrophy. Fatty subcutaneous and bone marrow adipose tissues are characterized by high signal intensities. The varying degrees and patterns of fat accumulation within the skeletal muscles are clearly evident.
Figure 3
Figure 3
Lower extremity left leg images of a patient with facioscapulohumeral dystrophy. In (A), a T1-weighted image is shown for anatomical reference. Note the evident heterogeneous fatty accumulation within the gastrocnemius medial (GM - solid arrow) and tibialis anterior (TA - dotted arrow) muscles. Multi-echo T2-mapping was used to generate (B) water and (C) fat component images. Note the clear separation and proper assignment of subcutaneous and bone marrow adipose tissue to the fat image. In both images, muscles significantly affected by fat (GM, TA) are strongly contrasted from less-fat-involved muscles (gastrocnemius lateral (GL) – open arrowhead, soleus (Sol) – solid arrowhead). A ratio between (B) and (C) can yield a fat-signal fraction map of the imaging slice for quantitative analysis.
Figure 4
Figure 4
An example of 2D proton chemical shift imaging for characterization of intra- (IMCL) and extramyocellular (EMCL) lipids in lower extremity skeletal muscles is illustrated. Prior to data acquisition from the volume-of-interest (blue grid outline), signals from subcutaneous adipose tissue are suppressed using outer volume suppression bands (shaded white rectangles). Note the differences in spectral separation between IMCL and EMCL methylene resonances, along with tCr – creatine and Tau – taurine. Illustration courtesy of Peter Vermathen, Ph.D., University Bern, Switzerland.
Figure 5
Figure 5
Demonstration of frequency-selective MRI in a bilayer water-oil phantom (A) with no RF suppression, (B) with RF suppression spectrally targeted on the water resonance, and (C) with RF suppression spectrally targeted on the methylene resonance of fat. All three images were acquired with otherwise same imaging parameters and system settings and are illustrated using the same grayscale window/level display. A vertical signal profile line is plotted from top to bottom along each image (black dashed line) and shown in the accompanying plots. In (B), water suppression has effectively saturated all water signals (black arrowhead). In (C), residual fat signals (arrow) remain in the oil compartment. This is because the oil contains unsaturated TG (e.g. olefinic protons, vinyl groups) and only proton signals from the methylene peak of fat have been selectively suppressed. Image ratios of (A-C) can yield methylene fat-signal fraction and water-signal fraction maps.
Figure 6
Figure 6
Frequency-selective MRI, demonstrated in the form of (A) water-suppression and (B) fat-suppression in the same subject at 3.0 Tesla. Good overall suppression is achieved, except in areas outlined by dashed boxes. In the water-suppressed image (A), the right oblique and transversus abdominis muscles show appreciable signal intensity. Conversely in the fat-suppressed image (B), subcutaneous adipose tissue within the dashed box has noticeable signal intensity. The poor local suppression performance is due to spatially varying B0 magnetic field inhomogeneity. Similar to Figure 5, note in (B) that the subcutaneous and visceral adipose tissue depots are not completely suppressed and exhibit residual signals (arrows).
Figure 7
Figure 7
An example of the two two-point Dixon technique, demonstrated in a subject with known non-alcoholic fatty liver disease (24% hepatic fat-signal fraction previously determined by spectroscopy). Two sets of images are acquired in a single scan with water and methylene fat signals (A) in-phase (IP) and (B) out-of-phase (OP). Note that the liver signal intensity (dashed arrow) in the OP image is markedly darker than in the IP image, indicative of possible steatosis. Similar signal variations can be observed in the pancreas (dotted tracing) and to a lesser extent in the muscles. Note that IP and OP signal variations are not observed in the subcutaneous and visceral adipose tissues (fat-dominant). For comparison, note also the vertebral bone marrow (arrow), which contains near equal amounts of water and fat. This leads to a near complete cancellation of water and fat signals in the OP image.
Figure 8
Figure 8
Examples of proton-density fat fraction maps from multi-echo water-fat MRI are shown in color on a full scale of 0-100%. An adult male, 43 years of age, (A) before and (B) after a 10-month self-initiated diet and exercise regimen is illustrated. The decrease in liver fat content (dashed arrow) and subcutaneous and visceral adipose tissue (mostly omental) volumes (solid arrows) is evident. The liver fat fraction in (A) was approximately 22%; in (B), it has reduced to approximately 6%. The two data sets were acquired on a 3.0 Tesla Signa HDx system from GE Healthcare. Representative axial images of the left thigh and calf from (C) an 11-year-old male and (D) an 11-year-old female with spina bifida (myelomeningocele), respectively, are shown. In (C), preferential fat accumulation in the biceps femoris muscle (dotted arrow) of the hamstrings is evident. In (D), almost all calf muscles show complete fat infiltration, and only the tibialis anterior muscle exhibits some remaining muscle tissues (dot-dash arrows). Leg data was acquired on a 3.0 Telsa Achieva system from Philips Healthcare.
Figure 9
Figure 9
A general schematic of multi-echo WFI. (Step 1) Data acquisition occurs at several echo times. (Step 2) Utilizing a multi-peak spectral model for fat (horizontal arrow: major methylene peak; vertical arrows: additional minor resonances), a reconstruction algorithm, often iterative, yields a set of co-registered grayscale water, fat, in-phase (IP), and out-of-phase (OP) volumes. (Step 3) In parallel, co-registered quantitative maps for T2* relaxation, B0 magnetic field inhomogeneity, and fat-signal fraction are generated. When noise and relaxometry effects are accounted for, the fat-signal fraction closely approximates the true underlying proton-density fat fraction. The seven outputs provide avenues for computing adipose tissue depot volumes and percent fat content in ectopic sites.
Figure 10
Figure 10
Representative coronal images from PET/MR of a 15-year old girl presenting for follow-up of Hodgkin's lymphoma. Images illustrate (A) water MRI, (B) fat MRI, (C) PET radiotracer uptake of 18F-FDG, and (D) fused PET/fat MRI, with unsuspicious results. However, symmetrical 18F-FDG uptake in the neck (arrows) is evident, and corresponds to the cervical and supraclavicular brown adipose tissue depots on the MR images. Data courtesy of Osman Ratib, M.D., Ph.D., University Hospitals of Geneva, and Benedicte Delattre, Ph.D. and Susanne Heinzer, Ph.D., Philips Healthcare Switzerland.
Figure 11
Figure 11
Coronal maximum-intensity projections of contrast-enhanced MR angiographic acquisitions in two neonates, (A)13-day-old male and (B) 1-day-old male, illustrating the clear uptake of Gadolinium contrast by the bilateral triangular-shaped supraclavicular fossa brown adipose tissue depots (arrows). Images courtesy of J. Paul Finn, M.D., University of California, Los Angeles.

References

    1. Ogden CL, Carroll MD, Kit BK, Flegal KM. Prevalence of obesity and trends in body mass index among US children and adolescents, 1999-2010. JAMA. 2012;307:483–490. - PMC - PubMed
    1. McAllister EJ, Dhurandhar NV, Keith SW, Aronne LJ, Barger J, Baskin M, Benca RM, Biggio J, Boggiano MM, Eisenmann JC, Elobeid M, Fontaine KR, Gluckman P, Hanlon EC, Katzmarzyk P, Pietrobelli A, Redden DT, Ruden DM, Wang C, Waterland RA, Wright SM, Allison DB. Ten putative contributors to the obesity epidemic. Crit Rev Food Sci Nutr. 2009;49:868–913. - PMC - PubMed
    1. Smith SR, Lovejoy JC, Greenway F, Ryan D, deJonge L, de la Bretonne J, Volafova J, Bray GA. Contributions of total body fat, abdominal subcutaneous adipose tissue compartments, and visceral adipose tissue to the metabolic complications of obesity. Metabolism. 2001;50:425–435. - PubMed
    1. Eckel RH, Grundy SM, Zimmet PZ. The metabolic syndrome. Lancet. 2005;365:1415–1428. - PubMed
    1. Després JP, Lemieux I, Bergeron J, Pibarot P, Mathieu P, Larose E, Rodés-Cabau J, Bertrand OF, Poirier P. Abdominal obesity and the metabolic syndrome: contribution to global cardiometabolic risk. Arterioscler Thromb Vasc Biol. 2008;28:1039–1049. - PubMed

Publication types

LinkOut - more resources