

Cerebral blood flow response to acute hypoxic hypoxia
- PMID: 24123253
- PMCID: PMC4114548
- DOI: 10.1002/nbm.3026
Cerebral blood flow response to acute hypoxic hypoxia
Abstract
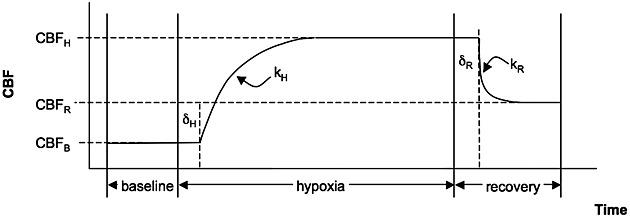
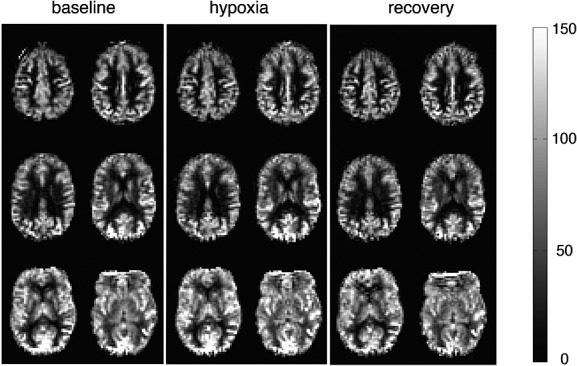
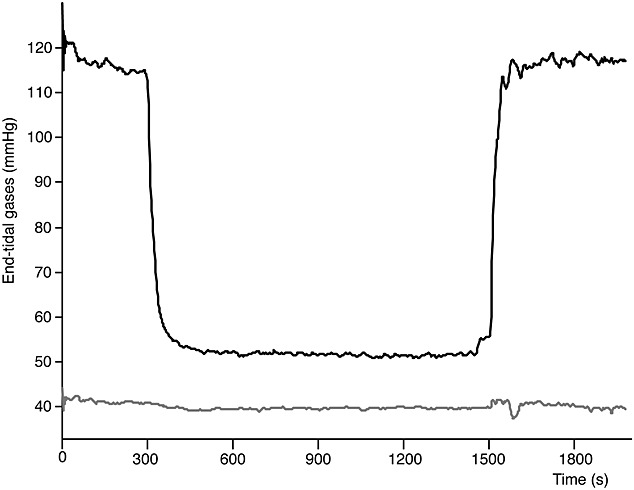
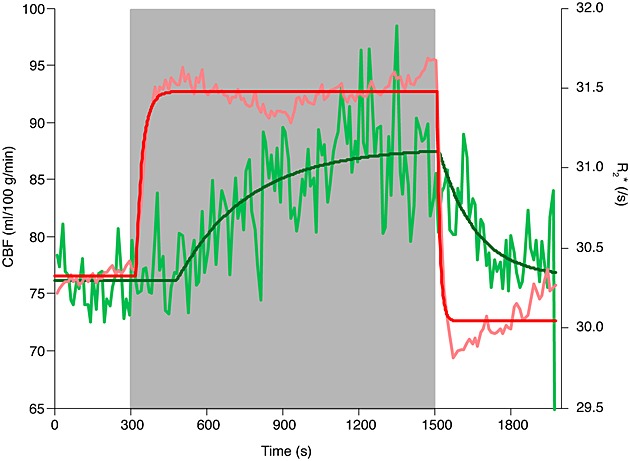
Hypoxic hypoxia (inspiratory hypoxia) stimulates an increase in cerebral blood flow (CBF) maintaining oxygen delivery to the brain. However, this response, particularly at the tissue level, is not well characterised. This study quantifies the CBF response to acute hypoxic hypoxia in healthy subjects. A 20-min hypoxic (mean P(ETO2) = 52 mmHg) challenge was induced and controlled by dynamic end-tidal forcing whilst CBF was measured using pulsed arterial spin labelling perfusion MRI. The rate constant, temporal delay and magnitude of the CBF response were characterised using an exponential model for whole-brain and regional grey matter. Grey matter CBF increased from 76.1 mL/100 g/min (95% confidence interval (CI) of fitting: 75.5 mL/100 g/min, 76.7 mL/100 g/min) to 87.8 mL/100 g/min (95% CI: 86.7 mL/100 g/min, 89.6 mL/100 g/min) during hypoxia, and the temporal delay and rate constant for the response to hypoxia were 185 s (95% CI: 132 s, 230 s) and 0.0035 s(-1) (95% CI: 0.0019 s(-1), 0.0046 s(-1)), respectively. Recovery from hypoxia was faster with a delay of 20 s (95% CI: -38 s, 38 s) and a rate constant of 0.0069 s(-1) (95% CI: 0.0020 s(-1), 0.0103 s(-1)). R2*, an index of blood oxygenation obtained simultaneously with the CBF measurement, increased from 30.33 s(-1) (CI: 30.31 s(-1), 30.34 s(-1)) to 31.48 s(-1) (CI: 31.47 s(-1), 31.49 s(-1)) with hypoxia. The delay and rate constant for changes in R2 * were 24 s (95% CI: 21 s, 26 s) and 0.0392 s(-1) (95% CI: 0.0333 s(-1), 0.045 s(-1)), respectively, for the hypoxic response, and 12 s (95% CI: 10 s, 13 s) and 0.0921 s(-1) (95% CI: 0.0744 s(-1), 0.1098 s(-1)/) during the return to normoxia, confirming rapid changes in blood oxygenation with the end-tidal forcing system. CBF and R2* reactivity to hypoxia differed between subjects, but only R2* reactivity to hypoxia differed significantly between brain regions.
Keywords: R2*; arterial spin labelling (ASL); blood oxygenation; cerebral blood flow (CBF); cerebral perfusion; hypoxia; temporal dynamics.
© 2013 The Authors. NMR in Biomedicine published by John Wiley & Sons, Ltd.
Figures
References
-
- Brugniaux JV, Hodges AN, Hanly PJ, Poulin MJ. Cerebrovascular responses to altitude. Respir. Physiol. Neurobiol. 2007;158(2–3):212–223. - PubMed
-
- Buck A, Schirlo C, Jasinksy V, Weber B, Burger C, von Schulthess GK, Koller EA, Pavlicek V. Changes of cerebral blood flow during short-term exposure to normobaric hypoxia. J. Cereb. Blood Flow Metab. 1998;18(8):906–910. - PubMed
-
- Wilson MH, Edsell ME, Davagnanam I, Hirani SP, Martin DS, Levett DZ, Thornton JS, Golay X, Strycharczuk L, Newman SP, Montgomery HE, Grocott MP, Imray CH. Cerebral artery dilatation maintains cerebral oxygenation at extreme altitude and in acute hypoxia—an ultrasound and MRI study. J. Cereb. Blood Flow Metab. 2011;31(10):2019–2029. - PMC - PubMed
-
- Kety SS, Schmidt CF. The determination of cerebral blood flow in man by the use of nitrous oxide in low concentrations. Am. J. Physiol. 1945;143(1):53–66.
Publication types
MeSH terms
Grants and funding
LinkOut - more resources
Full Text Sources
Other Literature Sources
