

Evidence of reporting biases in voxel-based morphometry (VBM) studies of psychiatric and neurological disorders
- PMID: 24123491
- PMCID: PMC6869352
- DOI: 10.1002/hbm.22384
Evidence of reporting biases in voxel-based morphometry (VBM) studies of psychiatric and neurological disorders
Abstract
Objectives: To evaluate whether biases may influence the findings of whole-brain structural imaging literature.
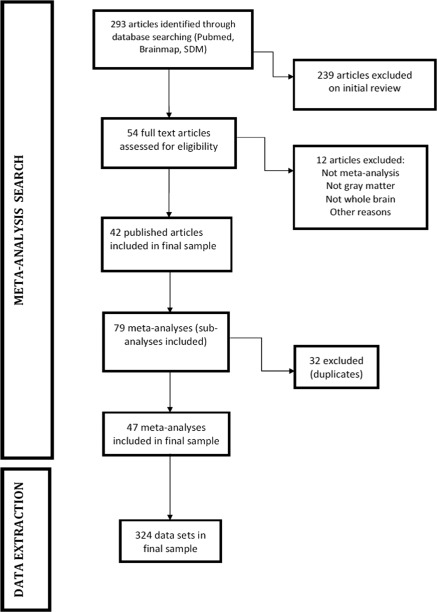
Methods: Forty-seven whole-brain voxel-based meta-analyses including voxel-based morphometry (VBM) studies in neuropsychiatric conditions were included, for a total of 324 individual VBM studies. The total sample size, the overall number of foci, and different moderators were extracted both at the level of the individual studies and at the level of the meta-analyses.
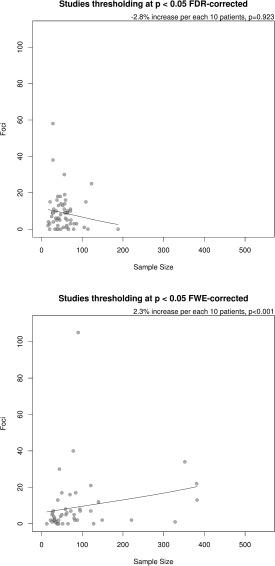
Results: Sample size ranged from 12 to 545 (median n = 47) per VBM study. The median number of reported foci per study was six. VBM studies with larger sample sizes reported only slightly more abnormalities than smaller studies (2% increase in the number of foci per 10-patients increase in sample size). A similar pattern was seen in several analyses according to different moderator variables with some possible modulating evidence for the statistical threshold employed, publication year and number of coauthors. Whole-brain meta-analyses (median sample size n = 534) found fewer foci (median = 3) than single studies and overall they showed no significant increase in the number of foci with increasing sample size. Meta-analyses with ≥10 VBM studies reported a median of three foci and showed a significant increase with increasing sample size, while there was no relationship between sample size and number of foci (median = 5) in meta-analyses with <10 VBM studies.
Conclusions: The number of foci reported in small VBM studies and even in meta-analyses with few studies may often be inflated. This picture is consistent with reporting biases affecting small studies.
Keywords: VBM; bias; dementia; neuroimaging; psychosis; structural.
Copyright © 2013 The Authors. Human Brain Mapping published by Wiley Periodicals, Inc.
Figures


References
-
- Ashburner J (2007a): A fast diffemorphic image registration algorithm. Neuroimage 38:95–113. - PubMed
-
- Ashburner J (2007b): A fast diffeomorphic image registration algorithm. Neuroimage 38:95–113. - PubMed
-
- Ashburner J, Friston KJ (2000): Voxel‐based morphometry‐the methods. Neuroimage 11:805–821. - PubMed
-
- Belsley DA, Kuh K, Welsch RE (1980): Regression diagnostics: Identifying influential data and sources of collinearity. New York: John Wiley & Sons.
-
- Borgwardt S, Fusar‐Poli P (2012): Third‐generation neuroimaging in early schizophrenia: Translating research evidence into clinical utility. Br J Psychiatry 200:270–272. - PubMed
MeSH terms
LinkOut - more resources
Full Text Sources
Other Literature Sources
Medical
