

Pattern classification of response inhibition in ADHD: toward the development of neurobiological markers for ADHD
- PMID: 24123508
- PMCID: PMC4190683
- DOI: 10.1002/hbm.22386
Pattern classification of response inhibition in ADHD: toward the development of neurobiological markers for ADHD
Abstract
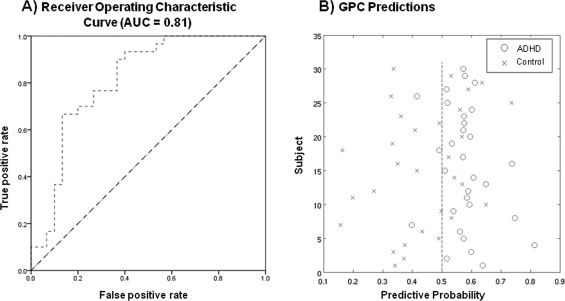
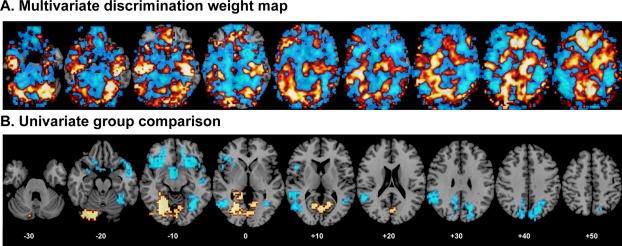
The diagnosis of Attention Deficit Hyperactivity Disorder (ADHD) is based on subjective measures despite evidence for multisystemic structural and functional deficits. ADHD patients have consistent neurofunctional deficits in motor response inhibition. The aim of this study was to apply pattern classification to task-based functional magnetic resonance imaging (fMRI) of inhibition, to accurately predict the diagnostic status of ADHD. Thirty adolescent ADHD and thirty age-matched healthy boys underwent fMRI while performing a Stop task. fMRI data were analyzed with Gaussian process classifiers (GPC), a machine learning approach, to predict individual ADHD diagnosis based on task-based activation patterns. Traditional univariate case-control analyses were also performed to replicate previous findings in a relatively large dataset. The pattern of brain activation correctly classified up to 90% of patients and 63% of controls, achieving an overall classification accuracy of 77%. The regions of the discriminative network most predictive of controls included later developing lateral prefrontal, striatal, and temporo-parietal areas that mediate inhibition, while regions most predictive of ADHD were in earlier developing ventromedial fronto-limbic regions, which furthermore correlated with symptom severity. Univariate analysis showed reduced activation in ADHD in bilateral ventrolateral prefrontal, striatal, and temporo-parietal regions that overlapped with areas predictive of controls, suggesting the latter are dysfunctional areas in ADHD. We show that significant individual classification of ADHD patients of 77% can be achieved using whole brain pattern analysis of task-based fMRI inhibition data, suggesting that multivariate pattern recognition analyses of inhibition networks can provide objective diagnostic neuroimaging biomarkers of ADHD.
Keywords: ADHD; Gaussian process classifier; biomarker; diagnosis; functional magnetic resonance imaging; inhibition.
Copyright © 2013 The Authors. Human Brain Mapping published by Wiley Periodicals, Inc.
Figures
References
-
- Adleman NE, Menon V, Blasey CM, White CD, Warsofsky IS, Glover GH, Reiss AL (2002): A developmental fMRI study of the stroop color‐word task. Neuroimage 16:61–75. - PubMed
-
- Alderson R, Rapport M, Kofler M (2007): Attention‐deficit/hyperactivity disorder and behavioral inhibition: A meta‐analytic review of the stop‐signal paradigm. J Abnormal Child Psychol 35:745–758. - PubMed
-
- American Psychiatric Association (2000): Diagnostic and Statistical Manual of Mental Disorders.American Psychiatric Association. Association AP, editor. Washington, DC.
-
- Aron AR, Fletcher PC, Bullmore ET, Sahakian BJ, Robbins TW (2003): Stop‐signal inhibition disrupted by damage to right inferior frontal gyrus in humans. Nat Neurosci 6:1329–1329. - PubMed
Publication types
MeSH terms
Substances
Grants and funding
LinkOut - more resources
Full Text Sources
Other Literature Sources
Medical
