

Lower NLRP3 inflammasome activity in NAG-1 transgenic mice is linked to a resistance to obesity and increased insulin sensitivity
- PMID: 24124102
- PMCID: PMC3981958
- DOI: 10.1002/oby.20638
Lower NLRP3 inflammasome activity in NAG-1 transgenic mice is linked to a resistance to obesity and increased insulin sensitivity
Abstract
Objective: The NLRP3 inflammasome plays an important regulatory role in obesity-induced insulin resistance. NSAID activated gene-1 (NAG-1) is a divergent member of the TGF-β superfamily. NAG-1 Tg mice are resistant to dietary- and genetic-induced obesity and have improved insulin sensitivity. The objective was to examine whether NLRP3 inflammasome activity is associated with this observed phenotype in NAG-1 Tg mice.
Methods: Key components of the NLRP3 inflammasome were examined in NAG-1 Tg mice on both regular and high fat diet (HFD) conditions.
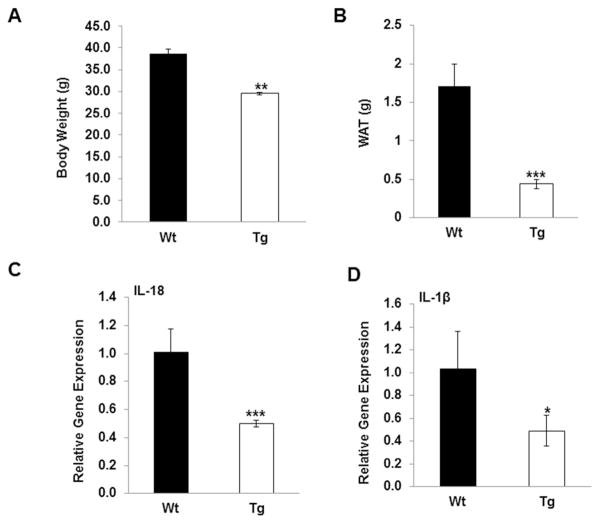
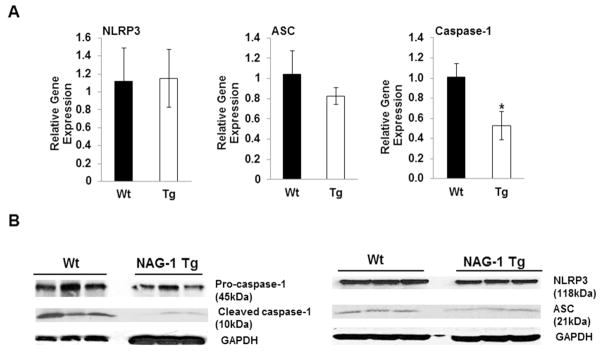
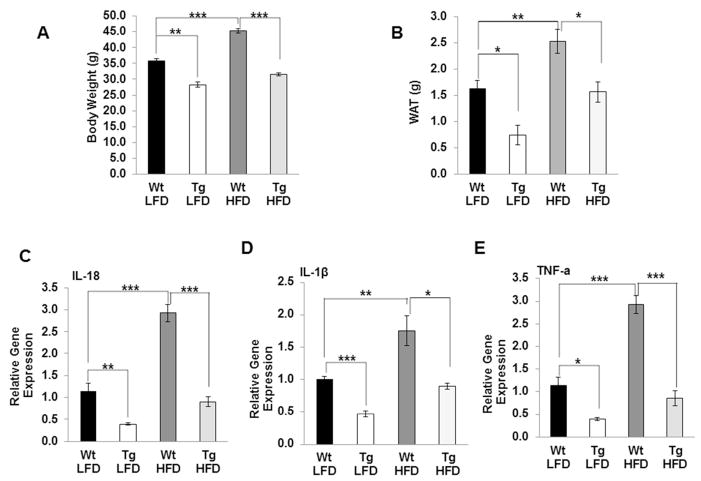
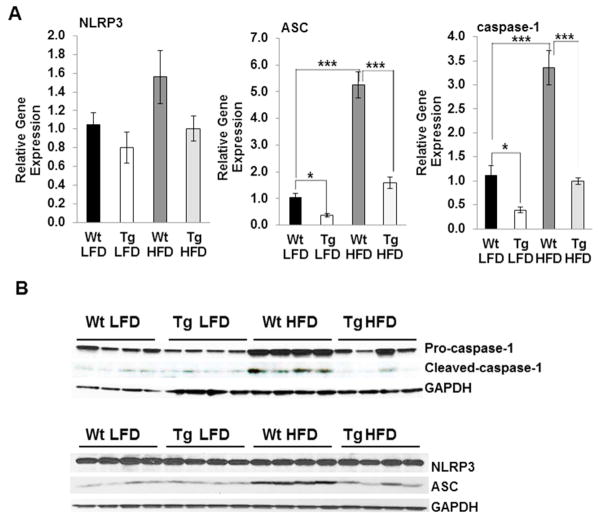
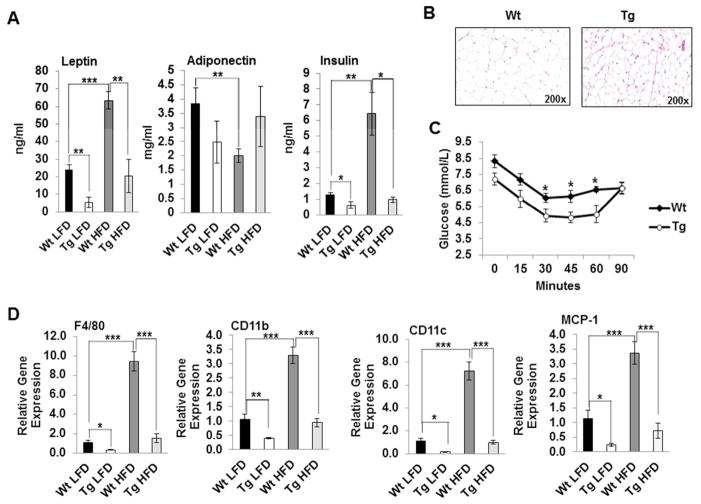
Results: The expression of caspase-1 and ASC, key components of the NLRP3 inflammasome, is significantly reduced at mRNA and protein levels in white adipose tissue (WAT) of NAG-1 Tg mice. HFD increases the expression of caspase-1 and ASC in WT mice, but their expression is reduced in NAG-1 Tg mice. Furthermore, there is reduced IL-18, IL-1β, and TNF-α expression in the WAT of NAG-1 Tg mice. NAG-1 Tg mice have significantly lower serum leptin and insulin levels and reduced expression of macrophage infiltration markers (F4/80, CD11b, and CD11c) in WAT.
Conclusions: The study suggests the lower NLRP3 inflammasome activity may play a role in the resistance of NAG-1 Tg mice to diet-induced obesity and improved insulin sensitivity.
Copyright © 2013 The Obesity Society.
Conflict of interest statement
The authors declare no conflicts of interests.
Figures
Similar articles
-
Elimination of the NLRP3-ASC inflammasome protects against chronic obesity-induced pancreatic damage.Endocrinology. 2011 Nov;152(11):4039-45. doi: 10.1210/en.2011-1326. Epub 2011 Aug 23. Endocrinology. 2011. PMID: 21862613 Free PMC article.
-
Dietary saturated fatty acids prime the NLRP3 inflammasome via TLR4 in dendritic cells-implications for diet-induced insulin resistance.Mol Nutr Food Res. 2012 Aug;56(8):1212-22. doi: 10.1002/mnfr.201200058. Epub 2012 Jun 15. Mol Nutr Food Res. 2012. PMID: 22700321
-
Activation of the NLRP3 Inflammasome Increases the IL-1β Level and Decreases GLUT4 Translocation in Skeletal Muscle during Insulin Resistance.Int J Mol Sci. 2021 Sep 23;22(19):10212. doi: 10.3390/ijms221910212. Int J Mol Sci. 2021. PMID: 34638553 Free PMC article.
-
Phosphodiesterase 3B (PDE3B) regulates NLRP3 inflammasome in adipose tissue.Sci Rep. 2016 Jun 20;6:28056. doi: 10.1038/srep28056. Sci Rep. 2016. PMID: 27321128 Free PMC article.
-
NLRP3 inflammasome: from a danger signal sensor to a regulatory node of oxidative stress and inflammatory diseases.Redox Biol. 2015;4:296-307. doi: 10.1016/j.redox.2015.01.008. Epub 2015 Jan 14. Redox Biol. 2015. PMID: 25625584 Free PMC article. Review.
Cited by
-
TFEB-GDF15 axis protects against obesity and insulin resistance as a lysosomal stress response.Nat Metab. 2021 Mar;3(3):410-427. doi: 10.1038/s42255-021-00368-w. Epub 2021 Mar 22. Nat Metab. 2021. PMID: 33758420
-
Reduced oxidative capacity in macrophages results in systemic insulin resistance.Nat Commun. 2018 Apr 19;9(1):1551. doi: 10.1038/s41467-018-03998-z. Nat Commun. 2018. PMID: 29674655 Free PMC article.
-
Contribution of membrane raft redox signalling to visfatin-induced inflammasome activation and podocyte injury.Aging (Albany NY). 2023 Nov 17;15(22):12738-12748. doi: 10.18632/aging.205243. Epub 2023 Nov 17. Aging (Albany NY). 2023. PMID: 38032896 Free PMC article.
-
hNAG-1 increases lifespan by regulating energy metabolism and insulin/IGF-1/mTOR signaling.Aging (Albany NY). 2014 Aug;6(8):690-704. doi: 10.18632/aging.100687. Aging (Albany NY). 2014. PMID: 25239873 Free PMC article.
-
Secreted proteins in treating metabolic dysfunction-associated steatotic liver disease: from bench towards bedside.Protein Cell. 2025 Aug 7;16(8):641-666. doi: 10.1093/procel/pwaf027. Protein Cell. 2025. PMID: 40243151 Free PMC article.
References
-
- Tack CJ, Stienstra R, Joosten LA, Netea MG. Inflammation links excess fat to insulin resistance: the role of the interleukin-1 family. Immunol Rev. 2012;249:239–52. - PubMed
Publication types
MeSH terms
Substances
Grants and funding
LinkOut - more resources
Full Text Sources
Other Literature Sources
Medical
Research Materials
Miscellaneous
