. 2013 Oct 4;8(10):e75738.
doi: 10.1371/journal.pone.0075738. eCollection 2013.

Bamboo vinegar decreases inflammatory mediator expression and NLRP3 inflammasome activation by inhibiting reactive oxygen species generation and protein kinase C-α/δ activation

Affiliations

Bamboo vinegar decreases inflammatory mediator expression and NLRP3 inflammasome activation by inhibiting reactive oxygen species generation and protein kinase C-α/δ activation

Chen-Lung Ho et al. PLoS One. .

Abstract

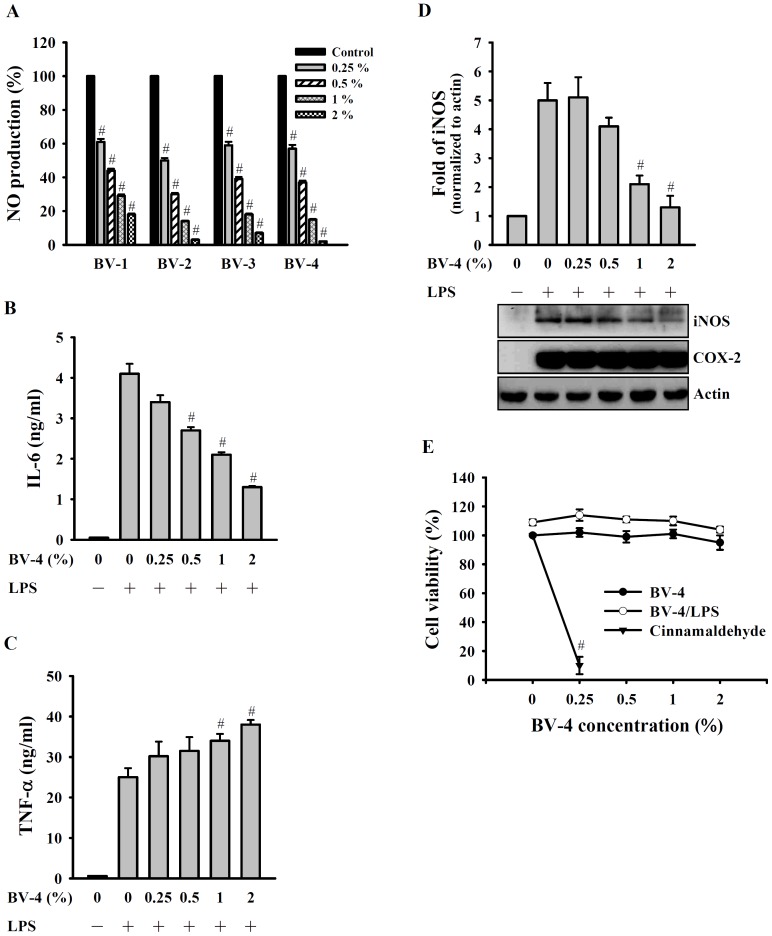
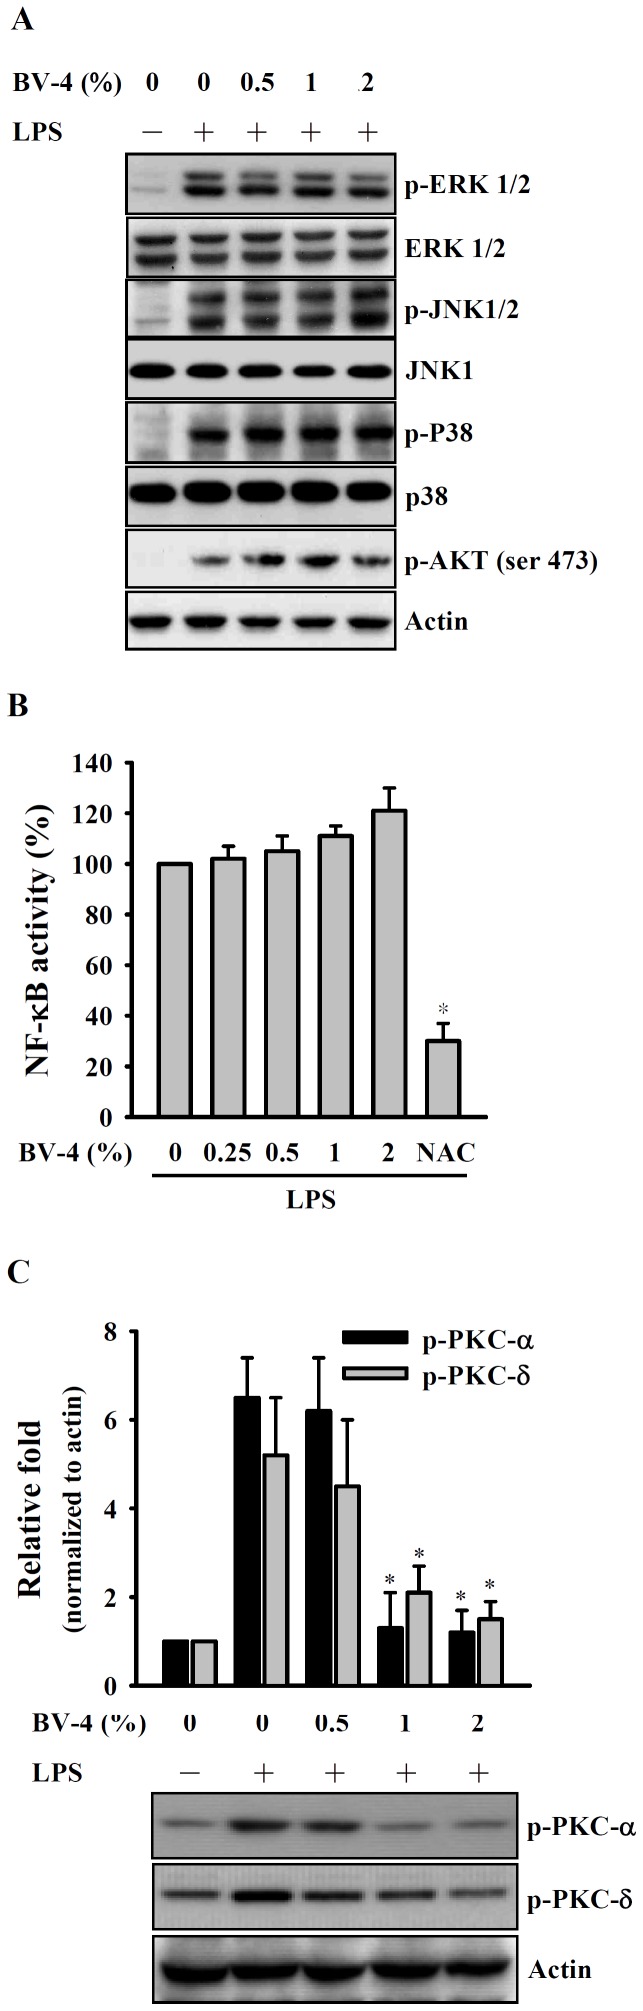
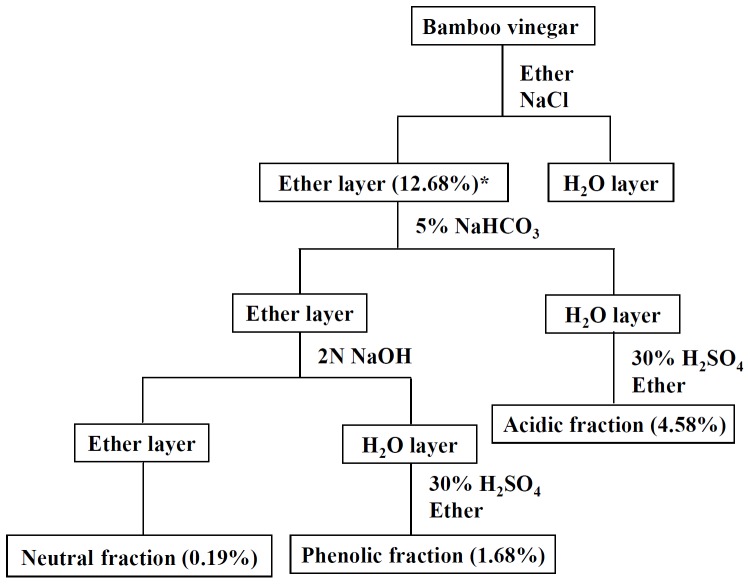
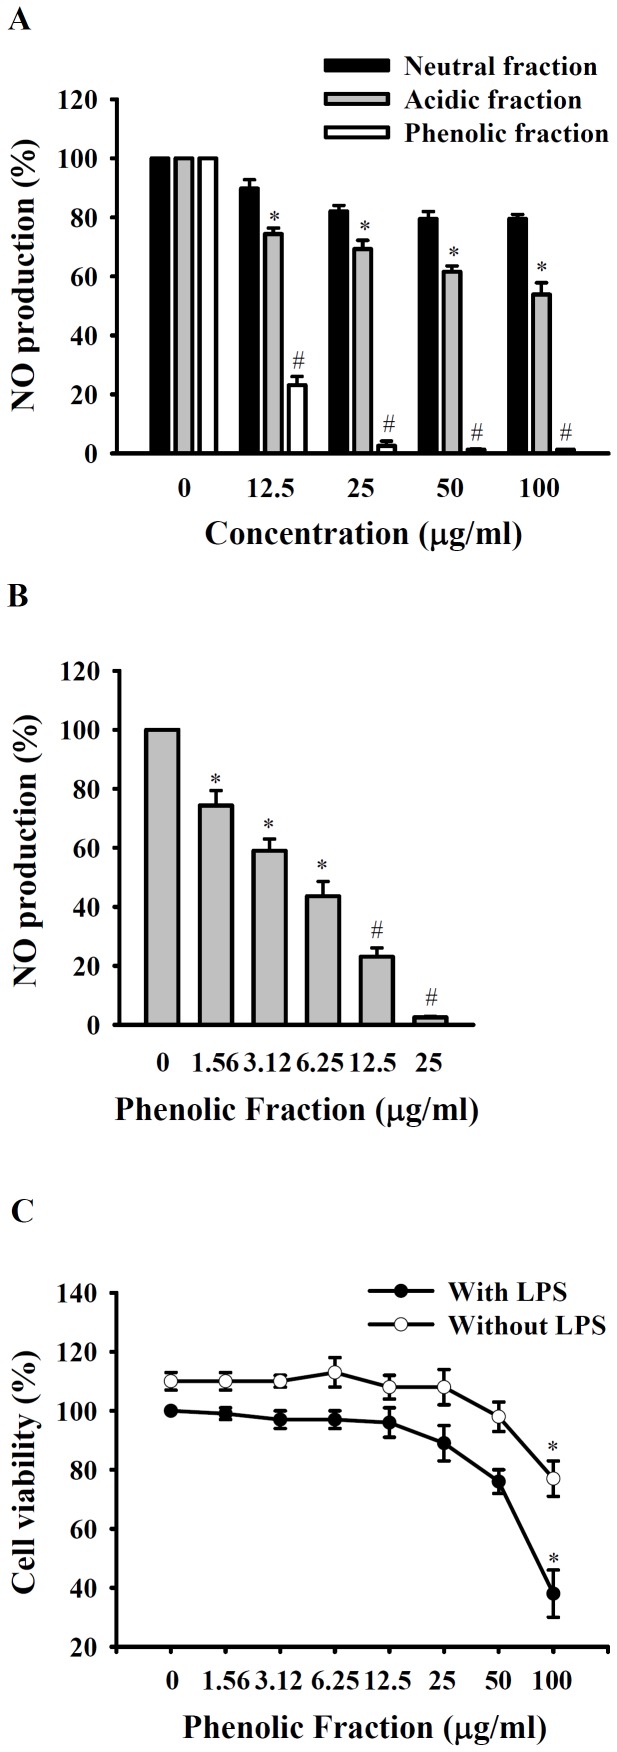
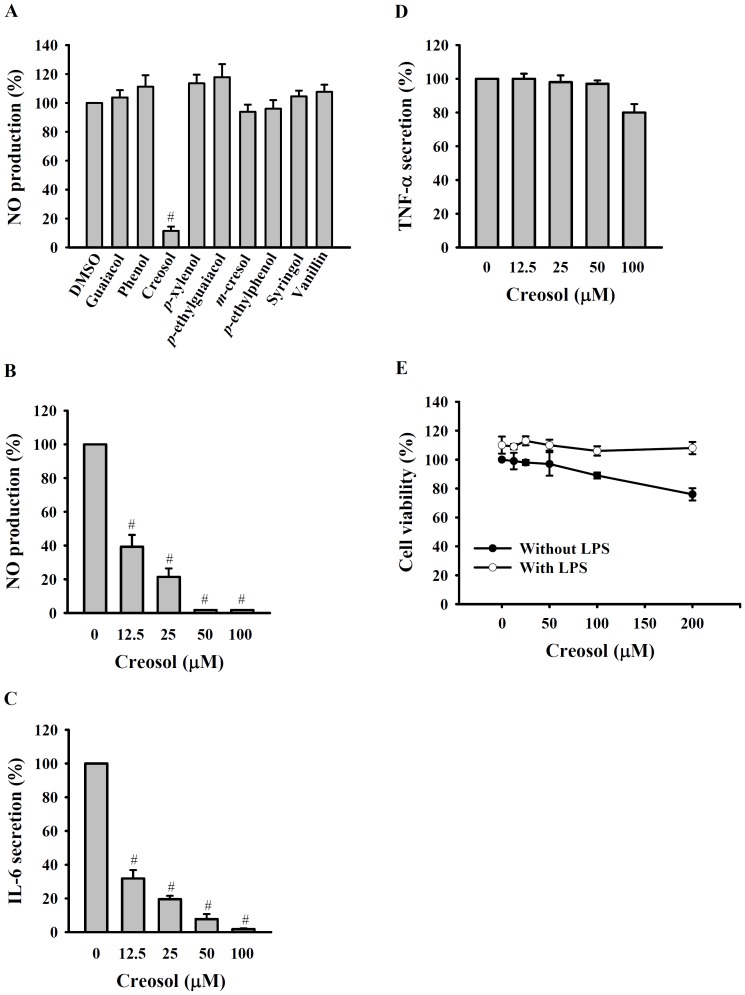
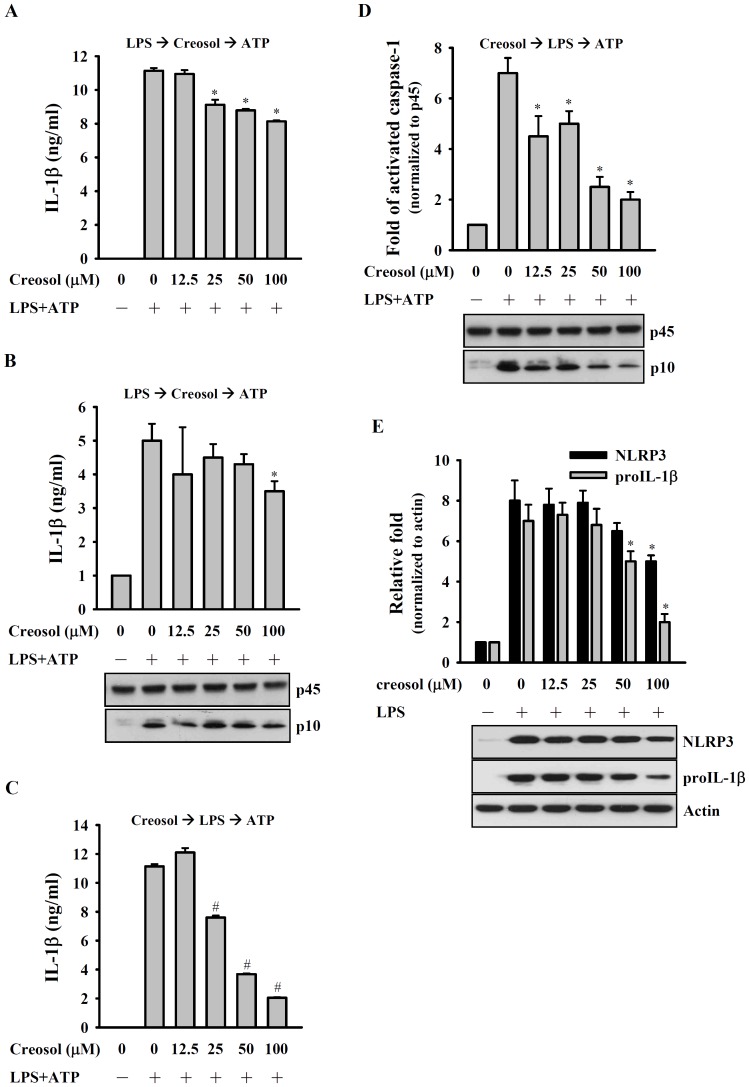
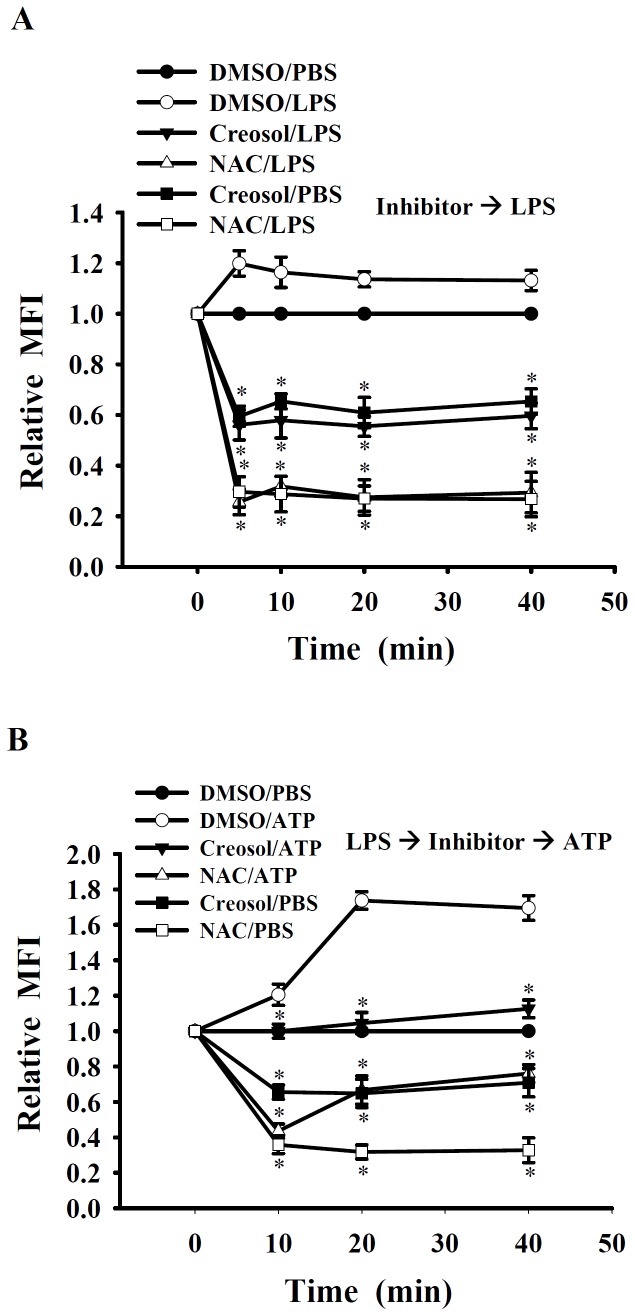
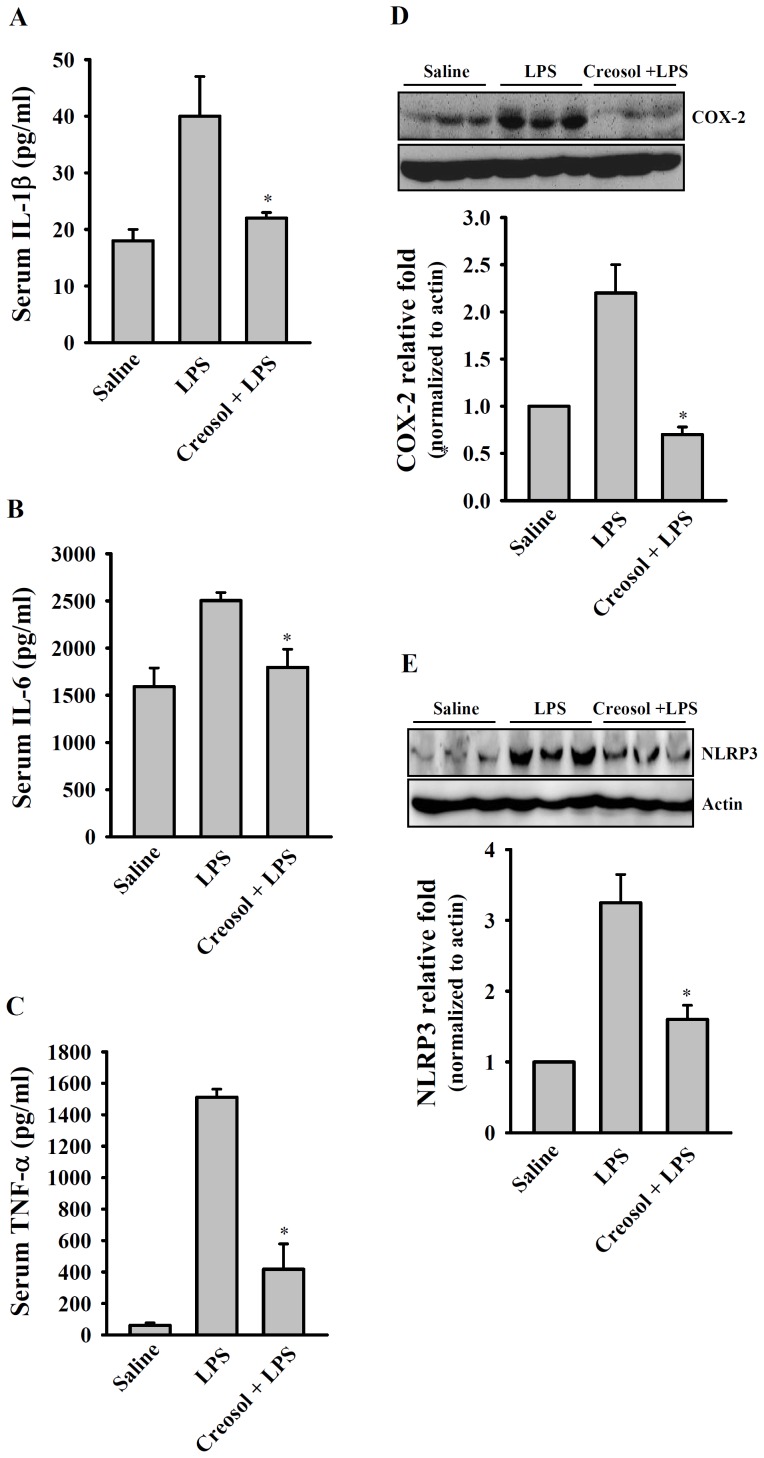
Bamboo vinegar (BV), a natural liquid derived from the condensation produced during bamboo charcoal production, has been used in agriculture and as a food additive, but its application to immune modulation has not been reported. Here, we demonstrated that BV has anti-inflammatory activities both in vitro and in vivo. BV reduced inducible nitric oxide synthase expression and nitric oxide levels in, and interleukin-6 secretion by, lipopolysaccharide-activated macrophages without affecting tumor necrosis factor-α secretion and cyclooxygenase-2 expression. The mechanism for the anti-inflammatory effect of BV involved decreased reactive oxygen species production and protein kinase C-α/δ activation. Furthermore, creosol (2-methoxy-4-methylphenol) was indentified as the major anti-inflammatory compound in BV. Impaired cytokine expression and NLR family, pyrin domain-containing 3 (NLRP3) inflammasome activation was seen in mice treated with creosol. These findings provide insights into how BV regulates inflammation and suggest that it may be a new source for the development of anti-inflammatory agents or a healthy supplement for preventing and ameliorating inflammation- and NLRP3 inflammasome-related diseases, including metabolic syndrome.


Conflict of interest statement

Competing Interests: KFH, SMK, and AC are co-inventors on a patent application describing bamboo vinegar treatment for inflammation. A patent application (13/448,722) has been submitted for the use of bamboo vinegar for treating inflammation. If this patent is licensed, it could generate royalty income for National Defense Medical Center and the inventors. This does not alter the authors’ adherence to all the PLOS ONE policies on sharing data and materials.

Figures

Figure 1
Figure 1. Effect of different BV samples and BV-4 on inflammatory mediator expression.
In (A), RAW 264.7 macrophages (1×10⁶ in 2 ml of medium) were incubated for 30 min with or without the indicated concentrations of BV-1, BV-2, BV-3, or BV-4, then for 24 h with or without addition of 1 µg/ml of LPS, then NO generation in the culture medium was measured by the Griess reaction. In (B), (C), and (D), RAW 264.7 macrophages (1×10⁶ in 2 ml of medium) were incubated for 30 min with or without the BV-4, then for 24 h with or without addition of 1 µg/ml of LPS, then IL-6 (B) and TNF-α (C) in the culture medium were measured by ELISA and levels of iNOS and COX-2 (D) in cell lysates were measured by Western blotting. In (E), RAW 264.7 macrophages (5×10⁴ in 1 ml of medium) were incubated for 30 min with or without the indicated concentration of BV-4 or 50 µM cinnamaldehyde, then for 24 h with or without addition of 1 µg/ml of LPS, then cell viability was measured using the AlamarBlue® assay. In (A), (B), (C), and (E), the data are expressed as the mean ± SD for three separate experiments, while, in (D), the lower panel shows a typical result and the histogram shows results for 3 experiments expressed as the mean ± SD. # indicate a significant difference at the respective level of p<0.001 compared to the LPS-treated group.
Figure 2
Figure 2. Effect of BV-4 on MAPK and PKC phosphorylation and NF-κB activation.
In (A) and (C), RAW 264.7 macrophages (1×10⁶ in 2 ml of medium) were incubated for 30 min with or without the indicated concentration of BV-4, then for 20 min with or without addition of 1 µg/ml of LPS, then phosphorylation of ERK1/2, JNK1/2, p38, AKT (A) and PKC-α/δ (C) was measured by Western blotting. In (B), RAW-Blue™ cells (1×10⁶ in 2 ml of medium) were incubated for 30 min with or without the indicated concentration of BV-4, then for 24 h with or without addition of 1 µg/ml of LPS, then secreted embryonic alkaline phosphatase activity was measured using QUANTI-Blue™. In (A) and (C), the results are representative of those obtained in three different experiments and the histogram shows the results for all 3 experiments expressed as the mean ± SD, while, in (B), the data are expressed as the mean ± SD for three separate experiments. *indicates a significant difference at the level of p<0.05 compared to the LPS-treated group.
Figure 3
Figure 3. Flow chart for the fractionation of BV-4.
Figure 4
Figure 4. Effect of BV-4 fractions on NO generation and cell viability.
In (A), RAW 264.7 macrophages (1×10⁶ in 2 ml of medium) were incubated for 30 min with or without the indicated concentrations of the neutral, acidic, or phenolic fraction of BV-4, then for 24 h with or without addition of 1 µg/ml of LPS, then NO generation in the culture medium was measured by the Griess reaction. In (B), RAW 264.7 macrophages (1×10⁶ in 2 ml of medium) were incubated for 30 min with or without the indicated concentration of the phenolic fraction of BV-4, then for 24 h with or without addition of 1 µg/ml of LPS, then NO generation in the culture medium was measured by the Griess reaction. In (C), RAW 264.7 macrophages (5×10⁴ in 1 ml of medium) were incubated for 30 min with or without the phenolic fraction of BV-4, then for 24 h with or without addition of 1 µg/ml of LPS, then cell viability was measured by the AlamarBlue® assay. The data are expressed as the mean ± SD for three separate experiments. *and # indicate a significant difference at the respective levels of p<0.05 and p<0.001 compared to the LPS-treated group.
Figure 5
Figure 5. Effect of creosol on inflammatory mediator expression and cell viability.
In (A), RAW 264.7 macrophages (1×10⁶ in 2 ml of medium) were incubated for 30 min with or without the test compound (50 µM), then for 24 h with or without addition of 1 µg/ml of LPS, then NO generation in the culture medium was measured by the Griess reaction. In (B), (C), and (D), RAW 264.7 macrophages (1×10⁶ in 2 ml of medium) were incubated for 30 min with or without the indicated concentration of creosol, then for 24 h with or without addition of 1 µg/ml of LPS, then NO generation in the culture medium was measured by the Griess reaction (B) and IL-6 (C) and TNF-α (D) levels in the culture medium were measured by ELISA. In (E), RAW 264.7 macrophages (5×10⁴ in 1 ml of medium) were incubated for 30 min with or without the indicated concentration of creosol, then for 24 h with or without addition of 1 µg/ml of LPS, then cell viability was measured by the AlamarBlue® assay. The data are expressed as the mean ± SD for three separate experiments. # indicates a significant difference at the respective levels of p<0.001 compared to the LPS-treated group.
Figure 6
Figure 6. Effect of creosol on NLRP3 inflammasome activation.
In (A) and (B), J774A.1 macrophages (2×10⁶ in 2 ml of medium) were incubated for 6 h with or without 1 µg/ml of LPS, then for 30 min with or without addition of the indicated concentration of creosol, followed by 30 min incubation with or without addition of 5 mM ATP, then IL-1β in the culture medium were measured by ELISA (A) and active caspase-1 (p10) and caspase-1 (p45) in the cells were measured by Western blotting (B). In (C) and (D), J774A.1 macrophages (2×10⁶ in 2 ml of medium) were incubated for 30 min with or without the indicated concentration of creosol, then for 6 h with or without addition of 1 µg/ml of LPS. After washing, the cells were incubated with or without 5 mM ATP for 30 min, then IL-1β in the culture medium was measured by ELISA (C) and active caspase-1 (p10) and caspase-1 (p45) in the cells measured by Western blotting (D). In (E), J774A.1 macrophages (2×10⁶ in 2 ml of medium) were incubated for 30 min with or without the indicated concentration of creosol and for 6 h with or without addition of 1 µg/ml of LPS, then expression of NLRP3 and proIL-1β was analyzed by Western blotting. In (A) and (C), the data are expressed as the mean ± SD for three separate experiments, while, in (B), (D), and (E), the results are representative of those obtained in three different experiments and the histogram shows the results for all 3 experiments expressed as the mean ± SD. *and # indicate a significant difference at the respective levels of p<0.05 and p<0.001 compared to the LPS+ATP-treated group (A-D) or the LPS-treated group (E).
Figure 7
Figure 7. Effect of creosol on LPS- and ATP-induced ROS production.
In (A), J774A.1 macrophages (1×10⁶ in 1 ml of medium) were incubated for 30 min with or without 50 µM creosol or 10 mM N-acetyl cysteine (NAC), then for 0–40 min with or without addition of 1 µg/ml of LPS. In (B), J774A.1 macrophages (1×10⁶ in 1 ml of medium) were incubated for 6 h with 1 µg/ml of LPS, then LPS was washout, then for 30 min with or without addition of 50 µM creosol or 10 mM NAC, then for 0–40 min with or without addition of 5 mM ATP. ROS production was measured as the relative mean fluorescence intensity (MFI), as described in the Materials and Methods. The data are expressed as the mean ± SD for three separate experiments. *indicates a significant difference at the level of p<0.05 compared to the DMSO/LPS-treated group (A) or the DMSO/ATP-treated group (B).
Figure 8
Figure 8. Effect of creosol on LPS-induced inflammation in vivo.
Three groups of mice (n = 6 each) were treated with LPS (3 µg/g body weight, given intraperitoneally), LPS (3 µg/g body weight, given intraperitoneally) plus creosol (30 µg/g body weight, given orally 24 h before LPS), or saline alone. At 4 h after LPS injection, serum was collected and assayed for IL-1β (A), IL-6 (B), and TNF-α (C) by ELISA, and, at 24 h, the spleen and liver were collected and assayed, respectively, for expression of COX-2 (D) or NLRP3 (E) by Western blotting. In (A), (B), and (C), the data are expressed as the mean ± SD for three separate experiments, while, in (D) and (E), the results are representative of those obtained in three different experiments and the histogram shows the results for all expressed as the mean ± SD. *indicates a significant difference at the level of p<0.05 compared to LPS-injected mice.

References

    1. Akakabe Y, Tamura Y, Iwamoto S, Takabayashi M, Nyuugaku T (2006) Volatile organic compounds with characteristic odor in bamboo vinegar. Biosci Biotechnol Biochem 70 2797–2799. - PubMed
    1. Chen YX, Huang XD, Han ZY, Huang X, Hu B et al. (2010) Effects of bamboo charcoal and bamboo vinegar on nitrogen conservation and heavy metals immobility during pig manure composting. Chemosphere 78 1177–1181. - PubMed
    1. Ruttanavut J, Matsumoto Y, Yamauchi K (2012) A fluorescence-based demonstration of intestinal villi and epithelial cell in chickens fed dietary silicic acid powder including bamboo vinegar compound liquid. Histol Histopathol 27 1333–1342. - PubMed
    1. Marumoto S, Yamamoto SP, Nishimura H, Onomoto K, Yatagai M et al. (2012) Identification of a germicidal compound against picornavirus in bamboo pyroligneous acid. J Agric Food Chem 60 9106–9111. - PubMed
    1. Medzhitov R, Janeway CA (1997) Innate immunity: the virtues of a nonclonal system of recognition. Cell 91 295–298. - PubMed

Publication types

LinkOut - more resources