. 2013 Oct 4;8(10):e76701.
doi: 10.1371/journal.pone.0076701. eCollection 2013.

Evolutionary origin of the mitochondrial cholesterol transport machinery reveals a universal mechanism of steroid hormone biosynthesis in animals

Affiliations

Evolutionary origin of the mitochondrial cholesterol transport machinery reveals a universal mechanism of steroid hormone biosynthesis in animals

Jinjiang Fan et al. PLoS One. .

Abstract

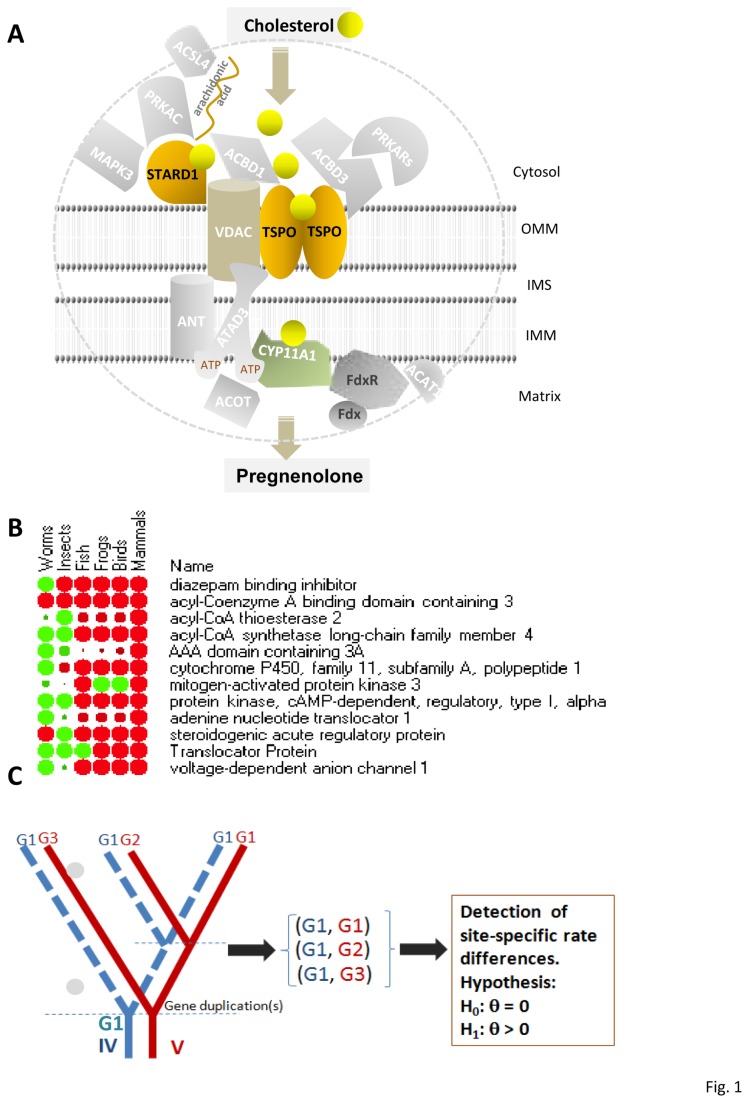
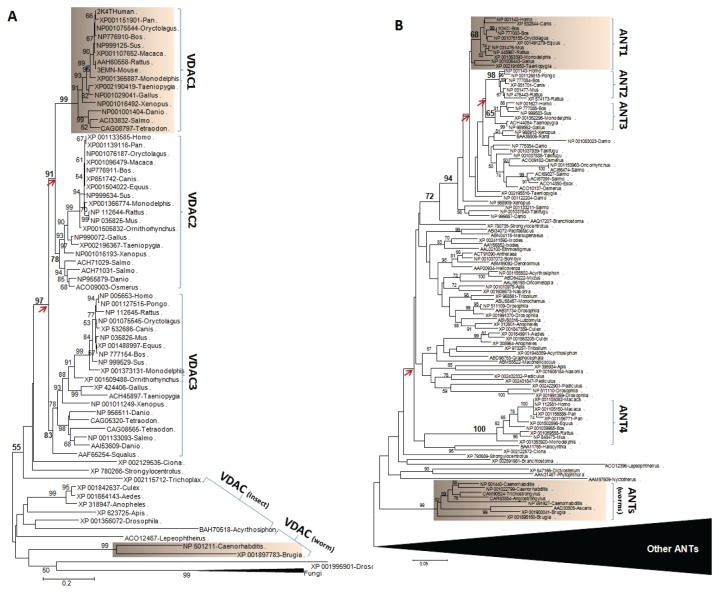
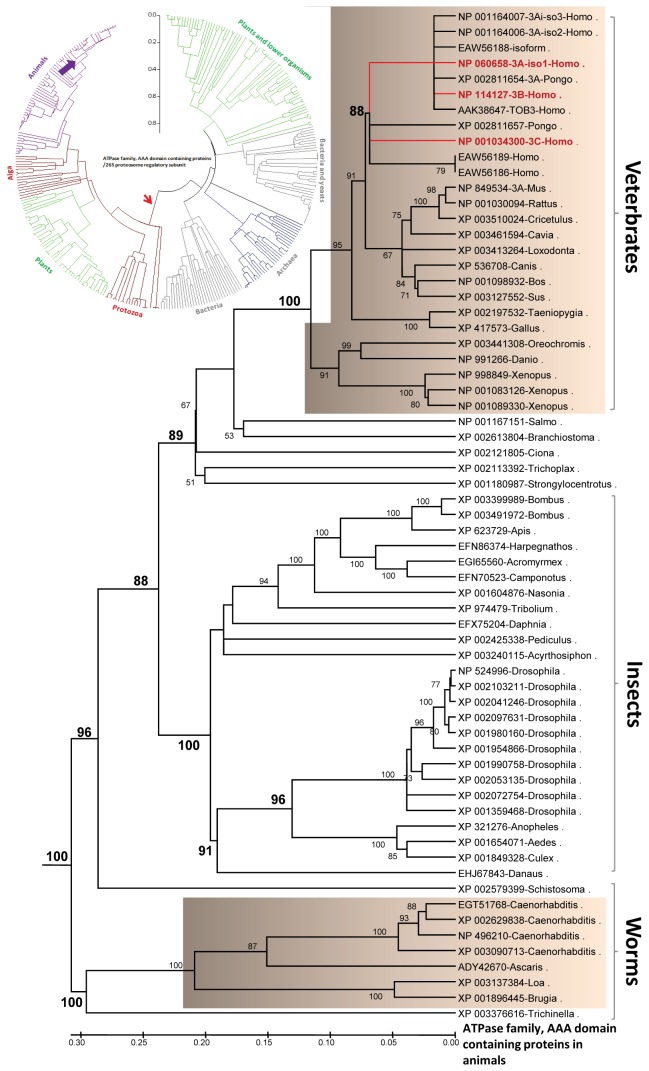
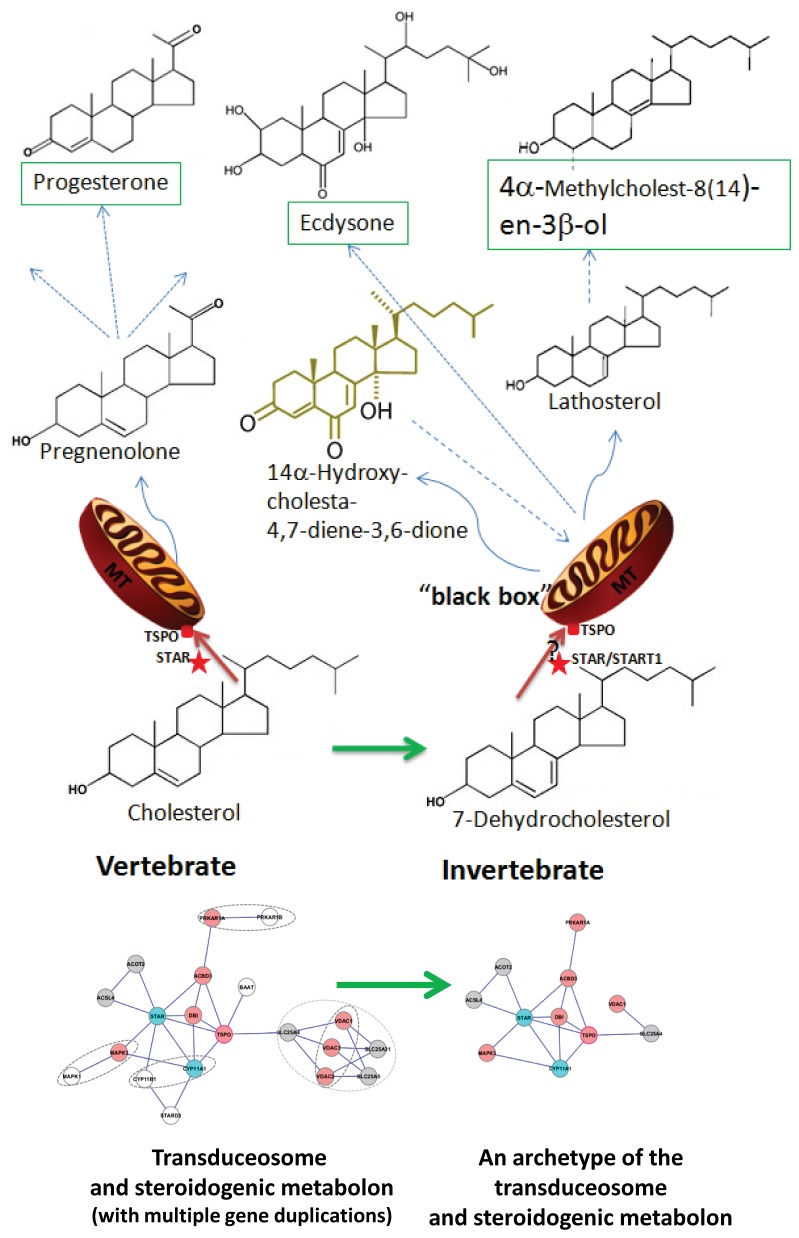
Steroidogenesis begins with the transport of cholesterol from intracellular stores into mitochondria via a series of protein-protein interactions involving cytosolic and mitochondrial proteins located at both the outer and inner mitochondrial membranes. In adrenal glands and gonads, this process is accelerated by hormones, leading to the production of high levels of steroids that control tissue development and function. A hormone-induced multiprotein complex, the transduceosome, was recently identified, and is composed of cytosolic and outer mitochondrial membrane proteins that control the rate of cholesterol entry into the outer mitochondrial membrane. More recent studies unveiled the steroidogenic metabolon, a bioactive, multimeric protein complex that spans the outer-inner mitochondrial membranes and is responsible for hormone-induced import, segregation, targeting, and metabolism of cholesterol by cytochrome P450 family 11 subfamily A polypeptide 1 (CYP11A1) in the inner mitochondrial membrane. The availability of genome information allowed us to systematically explore the evolutionary origin of the proteins involved in the mitochondrial cholesterol transport machinery (transduceosome, steroidogenic metabolon, and signaling proteins), trace the original archetype, and predict their biological functions by molecular phylogenetic and functional divergence analyses, protein homology modeling and molecular docking. Although most members of these complexes have a history of gene duplication and functional divergence during evolution, phylogenomic analysis revealed that all vertebrates have the same functional complex members, suggesting a common mechanism in the first step of steroidogenesis. An archetype of the complex was found in invertebrates. The data presented herein suggest that the cholesterol transport machinery is responsible for steroidogenesis among all vertebrates and is evolutionarily conserved throughout the entire animal kingdom.


Conflict of interest statement

Competing Interests: The authors have declared that no competing interests exist.

Figures

Figure 1
Figure 1. Machinery for mitochondrial cholesterol transport for steroidogenesis and functional prediction.
A. Schematic diagram of the transduceosome, steroidogenic metabolon, and associated signal transduction proteins and their likely roles in mitochondrial cholesterol transport and cholesterol metabolism into the first intermediate product, pregnenolone, during steroidogenesis. Each member and the closest members in their corresponding gene family were selected for further evolutionary analysis. IMM, inner mitochondrial membrane; IMS, intermembrane space; OMM, outer mitochondrial membrane. B. Orthologous origin of human TSPO-mediated steroidogenesis complex proteins in other animals. The proteins include Translocator Protein 18-kDa (TSPO) previously known as peripheral benzodiazepine receptor (PBR or BZRP), steroidogenic acute regulatory protein (STAR) or START domain containing 1 (STAR/STARD1), acyl-CoA binding domain containing 3 or PBR- and PKA-associated protein 7 (ACBD3/PAP7), cytochrome P450, family 11, subfamily A, polypeptide 1 (CYP11A1), acyl-CoA binding domain containing 1 or diazepam binding inhibitor (GABA receptor modulator, acyl-CoA binding protein; ACBD1/DBI), protein kinase, cAMP-dependent, regulatory, type I, alpha (PRKAR1A), ATPase family, AAA domain containing 3A (ATAD3), mitogen-activated protein kinase 3 or extracellular signal-regulated kinase ½ (MAPK3/ERK1/2), acyl-CoA synthetase long-chain family member 4 (ACSL4), acyl-CoA thioesterase 2/3 (ACOT2/3), voltage-dependent anion channel 1 (VDAC1), adenine nucleotide translocator 1 or solute carrier family 25 (mitochondrial carrier; adenine nucleotide translocator), member 4 (ANT1/SLC25A4). BLAST expectation value (e-value), a statistical calculation based on the score that gives the number of hits that this search would return by chance in a genome database, was used in the ranking of the best matches (“hits”) from the database. A higher e-value may suggest a distant evolutionary relationship. The max identity (percent similarity between the query and subject sequences over the length of the coverage area) was used to show the occurrence of the proteins in the organism as ink blots of the heatmap where the diameter of each dot corresponds to the value. That is, the ink blot is smallest exactly halfway between the minimum and maximum values and becomes progressively larger as the values approach the minimum or maximum. Green to red indicates the value (%) from smaller to bigger. The data was normalized in each row. C. The in silico prediction of functional divergence in protein evolution by site-specific rate shifts using the maximum likelihood method in DIVERGE [29]. G1-G3, paralogous gene number 1 to 3; IV, invertebrate; V, vertebrate; H0 and H1, hypothesis of the type I evolutionary functional divergence using a coefficient of statistical divergence (θ), which is the change in function that resulted from different rates at these sites between clusters. If the null hypothesis of θ = 0 was not rejected, the evolutionary rate is virtually the same between two clusters of genes, and this result implies that these clusters share the same function(s). The dotted line indicates that gene duplication did not occur.
Figure 2
Figure 2. Functional divergence analysis of TSPOs before and after gene duplication.
A. NJ-tree of TSPOs from human to worm. The evolutionary history was inferred using the Neighbor-Joining method [97]. The percentage of replicate trees in which the associated taxa clustered together in the bootstrap test (1000 replicates) is shown next to the branches. The tree is drawn to scale with branch lengths in the same units as those of the evolutionary distances used to infer the phylogenetic tree. The evolutionary distances were computed using the Dayhoff matrix-based method and are given in the units of the number of amino acid substitutions per site. All positions containing alignment gaps and missing data were eliminated only in pairwise sequence comparisons (pairwise deletion option). A total of 187 positions were analyzed in the final dataset. Phylogenetic analyses were conducted in MEGA4 [27]. The following sequences with accession numbers were used for the analysis: TSPO-Danio (NP_001006032), TSPO-Oncorhychus (AAK31586), TSPO-Tetradon (CAG06923), TSPO-Xeopus (AAH41505), TSPO-Drosophola (NP_608531), TSPO-elegans (NP_001129759), TSPO1-Pig (NP_998918), TSPO1-Mouse (P50637), TSPO1-Rat (NP_036647 NP_036647), TSPO1-CRA-b-Humans (NM_000714), TSPO1-Gallus (XP_416451), TSPO2-Gallus (XP_418037), TSPO2-Rat (XP_001063305), TSPO2-Mouse (NP_081568), TSPO2-Humans (NP_001010873), TSPO2-Pig (N166970). B. Site-specific profile for predicting critical amino acid residues responsible for type-I functional divergence between clusters TSPO (from invertebrates) and TSPO1 or TSPO2 as measured by posterior probability (Q1). Only one site, H159 (hTSPO1), is over 0.6 of Q1 value between TSPO/TSPO1, whereas there are 11 sites over 0.6 of Q1 value between TSPO/TSPO2.
Figure 3
Figure 3. Conserved elements in steroidogenesis machinery involved in cholesterol transport from humans to worms.
A. NJ tree for the START family. The orthologous genes of human STAR can be traced back to C. elegans. B. Homology modeling of the mouse STAR (left) and the evolutionary conservation profiles of the START family (right). The evolutionary conservation profiles are mapped on the homology 3-D ribbon model of mouse STAR, where the most conserved (score 9) residues are displayed by space-filled atoms. The amino acid residues are colored according to their conservation grades using the color-coding bar, with turquoise through maroon indicating variable through conserved, respectively [33]. C. NJ tree for the ACBD3 (PAP7) family. The orthologous genes of human ACBD3 form a unique branch and are highly conserved within animals (adapted from ACBD3 review [4]). D. NJ tree for the ACBD1/DBI family. The orthologous genes of human ACBD1 are limited within vertebrates but exhibit various sequence divergences and gene duplications (e.g. ACBD7).
Figure 4
Figure 4. Conserved elements of the steroidogenesis machinery involved in cholesterol transport in vertebrates.
A. NJ tree for the PPKAR1A family. The orthologous genes of human PPKAR1A are distributed within entire animals with strong bootstrap support, although gene duplication events occurred during vertebrate evolution. B. NJ tree for the CYP11A1 family. The orthologous genes of human Cyp11A1 are limited within vertebrates and were duplicated from Cyp11B1/B2/B3. C. The phylogeny of the invertebrate Mt CYP enzymes, CYP44A1 (NP_495052) and CYP314A1 (XP_002047883). D. Illustration of insertion of the human CYP11A1 into the mitochondrial inner membrane via an F-G loop, which is attached to the mitochondria inner membrane and is highlighted via a stick structure. The CRAC domain is shown as a ball-and-stick representation, and the cholesterol molecule is sitting within the steroid binding pocket and depicted in brown. The model was derived from PDB code 3NA1 (color in grey). E. Hydrophobicity profile of the F-G loops from CYP11A1, CYP11B1, and CYP44A1. The hydropathy indices were determined as described by Kyte & Doolittle [98]. Hydrophobic residues are indicated by positive values.
Figure 5
Figure 5. Comparison of putative steroid binding pockets from C. elegans CYP44A1 and CYP11A1.
A. Superimposition of the C. elegans CYP44A1 threading model (green) with human CYP11A1 (yellow). The F-G loop, which attaches to the mitochondrial inner membrane, and putative steroid binding pocket are indicated. B. The sites responsible for steroid binding in human CYP11A1 (PDB, 3NA1). C. The sites corresponding to the human CYP11A1 steroid binding pocket in Figure 6B and S2. The colors of each site are as illustrated. The unmatched sites are shown in the stick structure, and the remainder of the sites is shown in the space-filling model. D. Three predicted channels involved in HEM and steroid binding in CYP11A1, which is in complex with adrenodoxin reductase (AdR). E. Three potential channels involved in steroid binding in CYP44A1. The channels were predicted using MOLE 2.0 online service (http://mole.upol.cz) [99].
Figure 6
Figure 6. Comparative molecular docking analysis with the homology models of C. elegans CYP44A1 and the crystal structure of human CYP11A1 docking with cholesterol and 7-dehydrocholesterol.
A. Docking of CYP11A1 with cholesterol (left) and 7-dehydrocholesterol (right). B. Docking of CYP44A1 with cholesterol (left) and 7-dehydrocholesterol (right). The docking results are shown as the top conformation in rank of free energy. Protein structures are shown in ribbon representation. Cholesterol is in a ball-and-stick model (green).
Figure 7
Figure 7. Phylogenetic analysis of animal VDAC and adenine nucleotide translocase (ANT) families.
A. The phylogenetic tree of animal VDACs is based on the NJ analysis of entire animal sequences retrieved from GenBank. Fungi sequences were collapsed in the tree. B. The phylogenetic analysis of ANTs is based on the NJ analysis of entire animal sequences retrieved from GenBank. The ANT sequences other than animals are collapsed in the figure. The obvious gene duplication events are indicated by arrows. Levels of confidence of the nodes are only provided if support is greater than 50% by bootstrap analysis.
Figure 8
Figure 8. Phylogenetic analysis of ATAD3 sequences.
The top 500 sequences related to the mammalian ATAD3 were used in this analysis as shown as a circle phylogenetic tree (inset). This analysis illustrated the evolutionary distribution of the orthologous ATAD3 genes throughout animals, plants, and protists (such as alga and protozoa), indicated by a red arrow. Animal ATAD3-related sequences were subtracted as shown in an NJ tree. ATAD3 genes from vertebrates, insects, and worms clustered as a phylogenetic branch with strong bootstrap support. Gene duplication events in humans and likely in other primates as well are highlighted by red bold letters as 3A, 3B, and 3C after each GenBank accession number. The bootstrap values greater than 50% are indicated.
Figure 9
Figure 9. A diagram of the complex of evolutionary steroidogenesis in animals.
The main players in the complex, TSPO and STAR, are indicated on the surface of mitochondria. Precursors (cholesterol for vertebrates and 7-dehydrocholesterol for invertebrates), and first metabolites (pregnenolone for human and lathosterol for worms), intermediate metabolites (progesterone), and/or final products (ecdysone for insects) are indicated. The “black box” refers to the initial steps of steroidogenesis in insects as the enzymes in this process are unknown [100]. The predicted functional interaction networks of the proteins involved in the complex was generated using version 9.0 of the STRING database [101]. The dotted oval circles indicate the gene duplication event. Red indicates the gene is conserved from mammals to invertebrates, light blue indicates genes with sequence divergence but with similar biological function, grey indicates genes with divergence in both sequence and function, and white indicates that the duplicated gene may not be involved in the complex.

References

    1. Papadopoulos V, Miller WL (2012) Role of mitochondria in steroidogenesis. Best Pract Res Clin Endocrinol Metab 26: 771-790. doi: 10.1016/j.beem.2012.05.002. PubMed: 23168279. - DOI - PubMed
    1. Papadopoulos V, Baraldi M, Guilarte TR, Knudsen TB, Lacapère JJ et al. (2006) Translocator protein (18kDa): new nomenclature for the peripheral-type benzodiazepine receptor based on its structure and molecular function. Trends Pharmacol Sci 27: 402-409. doi: 10.1016/j.tips.2006.06.005. PubMed: 16822554. - DOI - PubMed
    1. Miller WL (2007) Mechanism of StAR’s regulation of mitochondrial cholesterol import. Mol Cell Endocrinol 265: 46-50. PubMed: 17207924. - PubMed
    1. Fan J, Liu J, Culty M, Papadopoulos V (2010) Acyl-coenzyme A binding domain containing. p. 3 (ACBD3; PAP7; GCP60): An emerging signaling molecule. Prog Lipid Res 49: 218-234 - PMC - PubMed
    1. Papadopoulos V, Liu J, Culty M (2007) Is there a mitochondrial signaling complex facilitating cholesterol import? Mol Cell Endocrinol 265-266: 59-64. doi: 10.1016/j.mce.2006.12.004. PubMed: 17280776. - DOI - PubMed

Publication types

MeSH terms

Substances