Early tumor development captured through nondestructive, high resolution differential phase contrast X-ray imaging
- PMID: 24125488
- PMCID: PMC3925470
- DOI: 10.1667/RR13327.1
Early tumor development captured through nondestructive, high resolution differential phase contrast X-ray imaging
Abstract
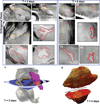
Although a considerable amount is known about molecular dysregulations in later stages of tumor progression, much less is known about the regulated processes supporting initial tumor growth. Insight into such processes can provide a fuller understanding of carcinogenesis, with implications for cancer treatment and risk assessment. Work from our laboratory suggests that organized substructure emerges during tumor formation. The goal here was to examine the feasibility of using state-of-the-art differential phase contrast X-ray imaging to investigate density differentials that evolve during early tumor development. To this end the beamline for TOmographic Microscopy and Coherent rAdiology experimenTs (TOMCAT) at the Swiss Light Source was used to examine the time-dependent assembly of substructure in developing tumors. Differential phase contrast (DPC) imaging based on grating interferometry as implemented with TOMCAT, offers sensitivity to density differentials within soft tissues and a unique combination of high resolution coupled with a large field of view that permits the accommodation of larger tissue sizes (1 cm in diameter), difficult with other imaging modalities.
Figures


Similar articles
-
Advanced phase-contrast imaging using a grating interferometer.J Synchrotron Radiat. 2009 Jul;16(Pt 4):562-72. doi: 10.1107/S0909049509017920. Epub 2009 Jun 2. J Synchrotron Radiat. 2009. PMID: 19535872
-
The second-order differential phase contrast and its retrieval for imaging with x-ray Talbot interferometry.Med Phys. 2012 Dec;39(12):7237-53. doi: 10.1118/1.4764901. Med Phys. 2012. PMID: 23231275
-
Correction of data truncation artifacts in differential phase contrast (DPC) tomosynthesis imaging.Phys Med Biol. 2015 Oct 7;60(19):7713-28. doi: 10.1088/0031-9155/60/19/7713. Phys Med Biol. 2015. PMID: 26394181
-
Synchrotron-based phase-contrast micro-CT as a tool for understanding pulmonary vascular pathobiology and the 3-D microanatomy of alveolar capillary dysplasia.Am J Physiol Lung Cell Mol Physiol. 2020 Jan 1;318(1):L65-L75. doi: 10.1152/ajplung.00103.2019. Epub 2019 Oct 9. Am J Physiol Lung Cell Mol Physiol. 2020. PMID: 31596108
-
Experimental Realisation of High-sensitivity Laboratory X-ray Grating-based Phase-contrast Computed Tomography.Sci Rep. 2016 Apr 4;6:24022. doi: 10.1038/srep24022. Sci Rep. 2016. PMID: 27040492 Free PMC article.
Cited by
-
Neovascularization of hepatocellular carcinoma in a nude mouse orthotopic liver cancer model: a morphological study using X-ray in-line phase-contrast imaging.BMC Cancer. 2017 Jan 25;17(1):73. doi: 10.1186/s12885-017-3073-3. BMC Cancer. 2017. PMID: 28122521 Free PMC article.
References
-
- Hahnfeldt P. The Host Support Niche as a Control Point for Tumor Dormancy: Implications for Tumor Development and Beyond. In: Enderling H, Almog N, Hlatky L, editors. Systems Biology of Tumor Dormancy. New York: Springer; 2013. pp. 19–36. - PubMed
-
- Hahnfeldt P, Panigrahy D, Folkman J, Hlatky L. Tumor development under angiogenic signaling: a dynamical theory of tumor growth, treatment response, and postvascular dormancy. Cancer Res. 1999;59:4770–4775. - PubMed
-
- Folkman J, Hahnfeldt P, Hlatky L. Cancer: looking outside the genome. Nat Rev Mol Cell Biol. 2000;1:76–79. - PubMed
-
- Denaro N, Russi EG, Colantonio I, Adamo V, Merlano MC. The role of antiangiogenic agents in the treatment of head and neck cancer. Oncology. 2012;83:108–116. - PubMed
Publication types
MeSH terms
Grants and funding
LinkOut - more resources
Full Text Sources
Other Literature Sources
Medical

