. 2013 Oct 21;210(11):2435-66.
doi: 10.1084/jem.20130762. Epub 2013 Oct 14.

Transient regulatory T cell ablation deters oncogene-driven breast cancer and enhances radiotherapy

Affiliations

Transient regulatory T cell ablation deters oncogene-driven breast cancer and enhances radiotherapy

Paula D Bos et al. J Exp Med. .

Abstract

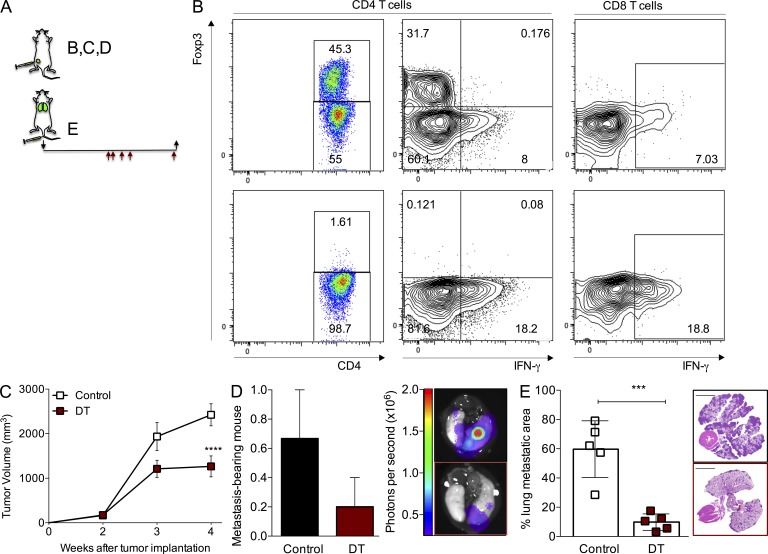
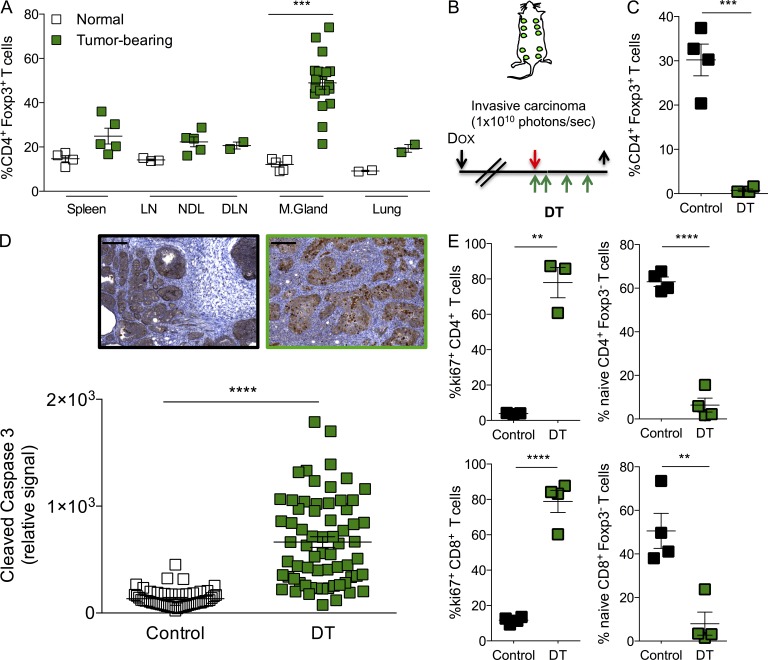
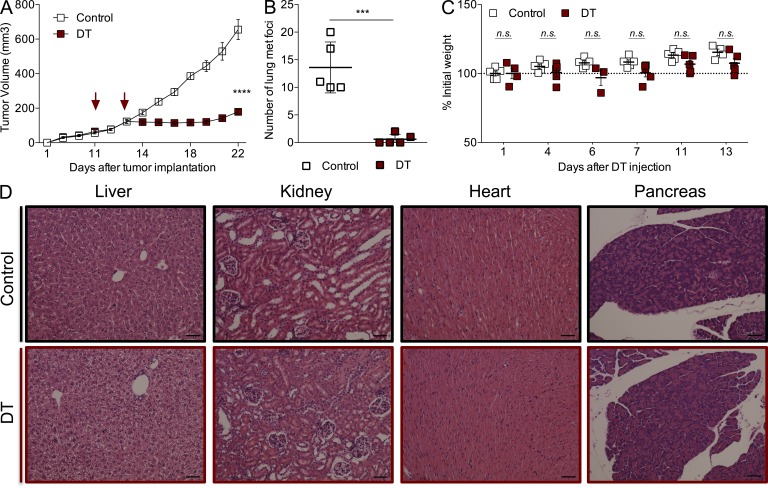
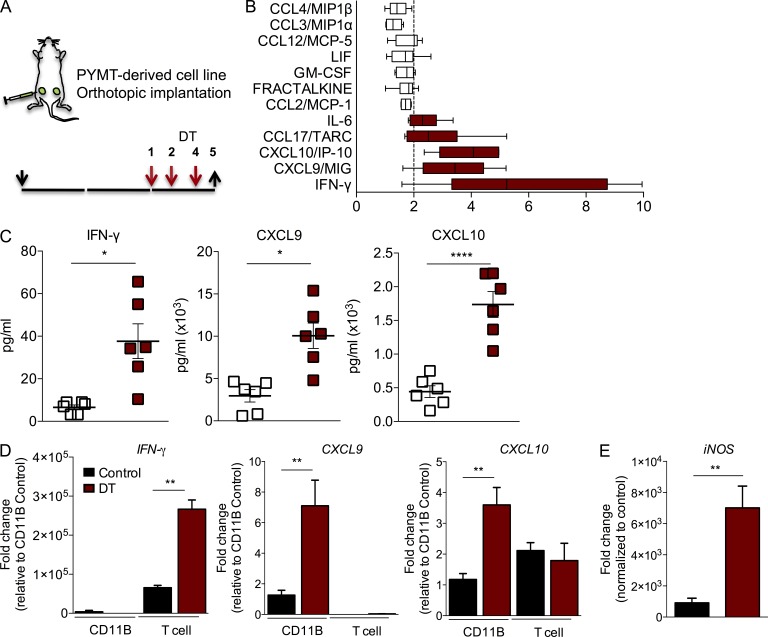
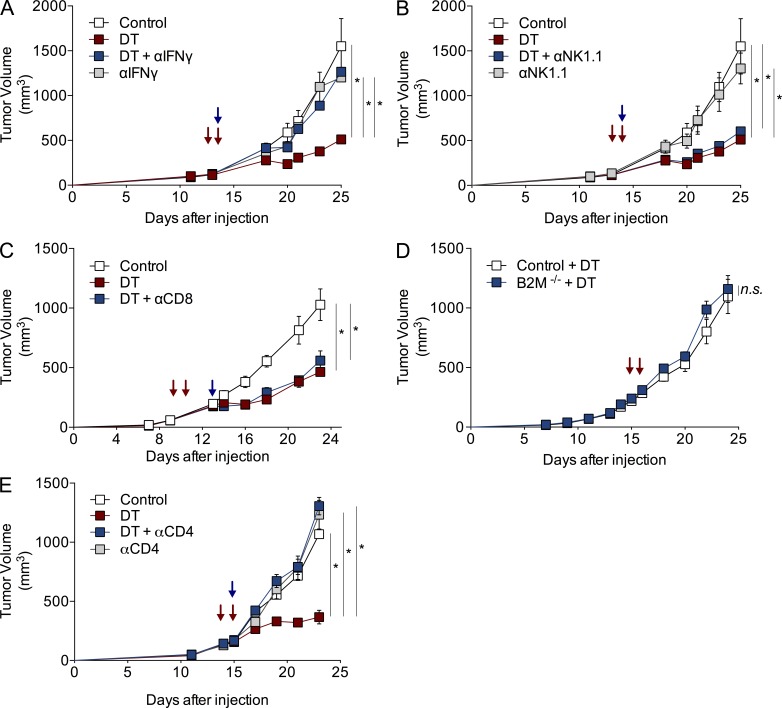
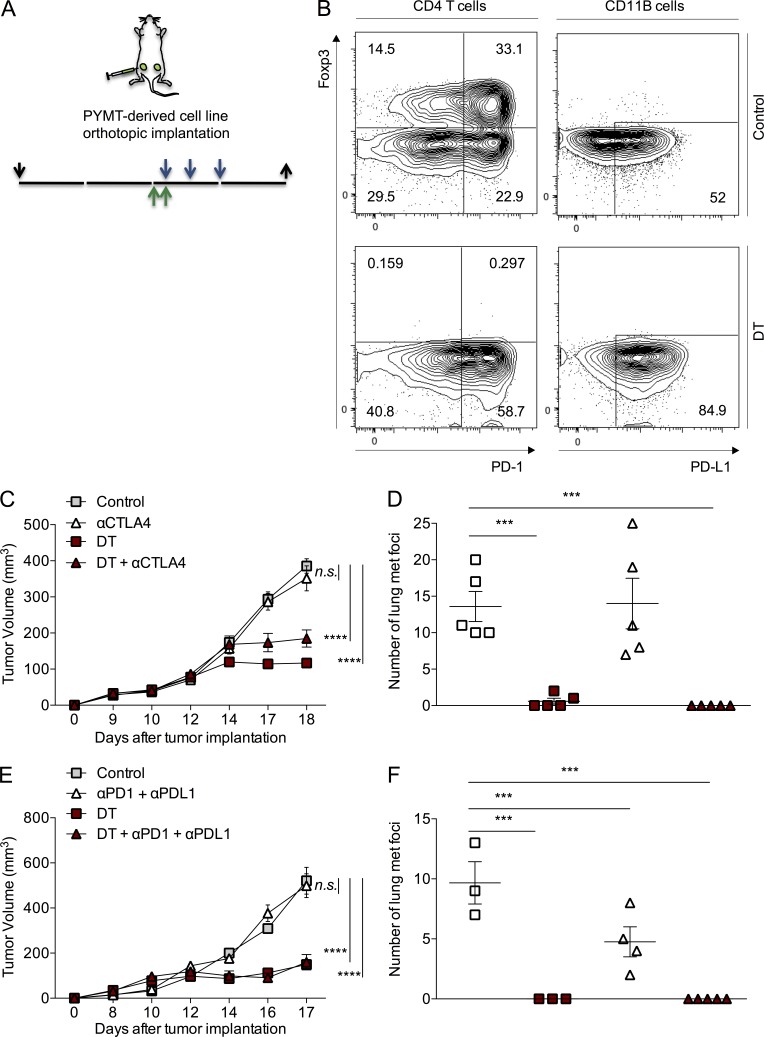
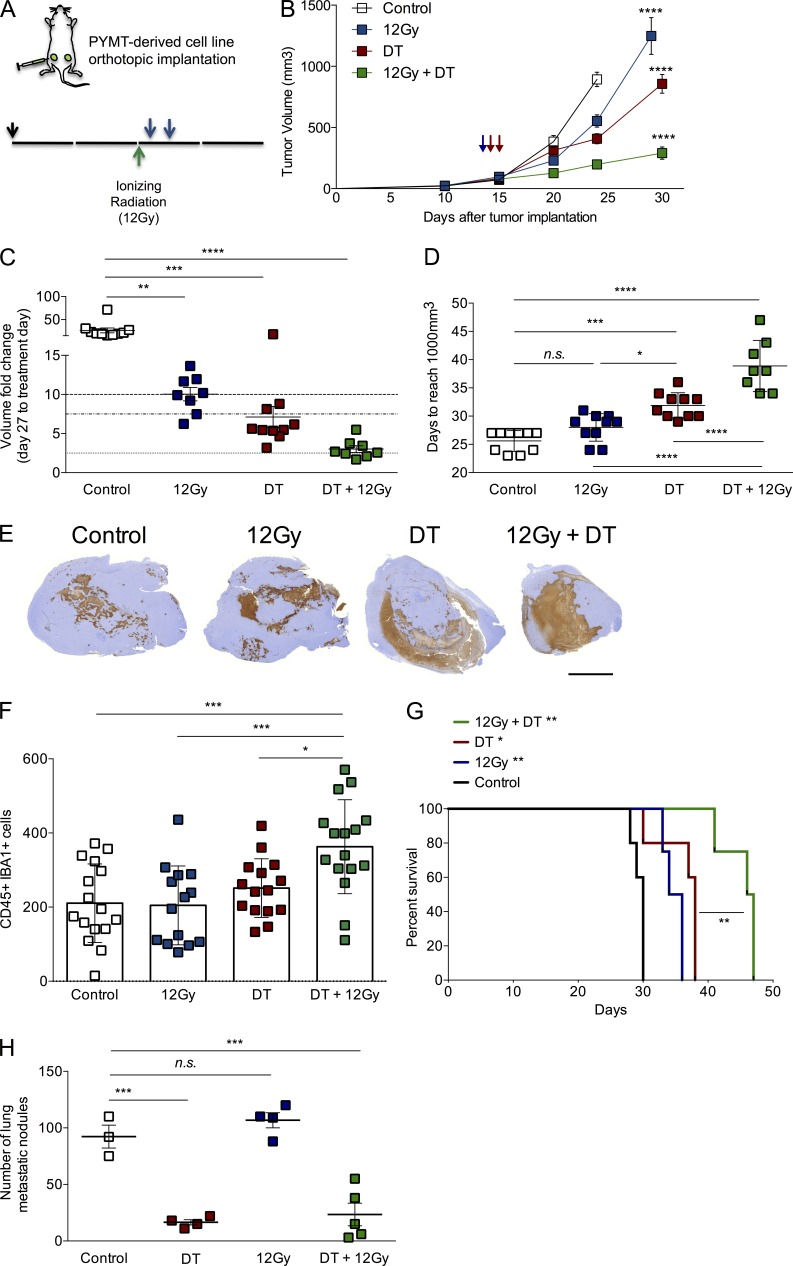
Rational combinatorial therapeutic strategies have proven beneficial for the management of cancer. Recent success of checkpoint blockade in highly immunogenic tumors has renewed interest in immunotherapy. Regulatory T (T reg) cells densely populate solid tumors, which may promote progression through suppressing anti-tumor immune responses. We investigated the role of T reg cells in murine mammary carcinogenesis using an orthotopic, polyoma middle-T antigen-driven model in Foxp3(DTR) knockin mice. T reg cell ablation resulted in significant determent of primary and metastatic tumor progression. Importantly, short-term ablation of T reg cells in advanced spontaneous tumors led to extensive apoptotic tumor cell death. This anti-tumor activity was dependent on IFN-γ and CD4(+) T cells but not on NK or CD8(+) T cells. Combination of T reg cell ablation with CTLA-4 or PD-1/PD-L1 blockade did not affect tumor growth or improve the therapeutic effect attained by T reg cell ablation alone. However, T reg cell targeting jointly with tumor irradiation significantly reduced tumor burden and improved overall survival. Together, our results demonstrate a major tumor-promoting role of T reg cells in an autochthonous model of tumorigenesis, and they reveal the potential therapeutic value of combining transient T reg cell ablation with radiotherapy for the management of poorly immunogenic, aggressive malignancies.


Figures

Figure 1.
Figure 1.
Ablation of T reg cells affects the growth of fully established primary and lung metastatic tumors. (A) Schematic of the experimental set up. Black arrows indicate day of tumor implantation (↓) and analysis (↑). Red arrows indicate regimen of DT treatment (days 14, 15, 17, 19, and 25 after tumor cell implantation). (B) Flow cytometric quantification of intratumoral CD4+ Foxp3+ T cells (left) and IFN-γ production in T cells (right). Top: control; bottom: DT-treated. (C) Growth kinetics of orthotopic tumors in mice treated with 50 µg/kg DT when tumors reached a volume of ∼250 mm3. A representative of two independent experiments is shown; n = 5 mice per group; ****, P < 0.0001. Error bars represent SEM. (D) Fraction and representative image of mice with detectable lung metastasis upon bioluminescence imaging of the dissected lungs from the group depicted in C. Error bars represent SEM. (E) Histological quantification and representative H&E staining image of the area of the lungs occupied with tumors in experimental lung colonization experiments; bars, 5,000 µm; ***, P < 0.001. Error bars represent SD. Mice were injected with 5 × 10⁵ PyMT-derived cancer cells in the tail vein and treated with DT 2 wk after tumor injection with the schedule shown in A. P-values were calculated using ANOVA, followed by Bonferroni’s post-hoc test (C) and Student’s t test (E).
Figure 2.
Figure 2.
Ablation of T reg cells results in tumor cell death in autochthonous breast tumors. (A) Frequency of CD4+ Foxp3+ T reg cells in indicated organs of control (clear squares) and tumor-bearing (green squares) MMTV-rtTA; tet-O-PyMT (TOMT) mice. ***, P < 0.001. (B) Schedule of DT treatment in TOMT mice. Black arrows indicate days of doxycycline administration (↓) and analysis (↑). Red arrow indicates day the tumors reach mass emitting 1010 photons per second. Green arrows indicate administration of DT. (C) Flow cytometric quantification of intratumoral CD4+ Foxp3+ T reg cells at end point (10 d after the first DT injection). A representative of at least three independent experiments is shown, n = 4; ***, P < 0.001. (D) Histological quantification and representative images of tumor cell death by cleaved caspase-3 immunohistochemistry. n = 3–7 mice per group; ****, P < 0.0001; bars, 200 µm. (E) Flow cytometric determination of the frequency of intratumoral proliferating (Ki67+) and naive (CD62LhighCD44lo) CD4+ and CD8+ T cells. A representative of at least three independent experiments is shown; n = 3–4 mice per group. Error bars represent SEM. **, P < 0.01; ****, P < 0.0001. NDL: nondraining LN; DLN: draining LN; M. Gland: mammary gland. P-values were calculated using Student’s t test.
Figure 3.
Figure 3.
Transient T reg cell ablation is sufficient for inhibition of tumor growth without significant side effects. (A) Growth kinetics of orthotopically implanted tumors treated with 25 µg/kg DT at the indicated times; ****, P < 0.0001. Error bars represent SEM. (B) Number of metastatic nodules present on the lung surface upon examination under a dissection microscope; ***, P < 0.001. Error bars represent SD. (C) Body weight fluctuations represented as percentage of weight at the time of initial DT administration. Error bars represent SEM. (D) Representative histological images of liver, kidney, heart, and pancreas from control and DT-treated mice 2 wk after treatment. n = 3–5 mice per group, representative of at least three independent experiments. Bars, 50 µm. P-values were calculated using ANOVA followed by Bonferroni’s post-hoc test (A) and Student’s t test (B).
Figure 4.
Figure 4.
T reg cell ablation results in increased production of IFN-γ and IFN-γ–dependent changes. (A) Scheme of DT treatment. Black arrows indicate day of tumor implantation (↓) and analysis (↑). Red arrows indicate regimen of DT treatment. (B) Significant changes in chemokine and cytokine levels in tumor lysates from DT-treated mice analyzed by cytokine/chemokine array. X-axis represents fold change compared with control. A representative of two independent experiments is shown, n = 3 mice with two tumors each analyzed per group. Error bars represent minimum and maximum. (C) Analysis of IFN-γ, CXCL9, and CXCL10 protein levels in tumor lysates from control and DT-treated mice using multiplex bead assay. The data are shown as concentrations of indicated factors (pg/ml). A representative of two independent experiments is shown. *, P < 0.05; ****, P < 0.0001. Error bars represent SEM. (D) qPCR analysis of cell type–specific expression of IFN-γ, CXCL9, and CXCL10. RNA was extracted from CD45+ TCR-β CD11B+ Gr1 or CD45+ TCR-β+ CD11B FACS-purified cells; n = 3 mice per group; **, P < 0.01. Error bars represent SEM. (E) qPCR analysis of iNOS, consistent with classical polarization of myeloid cells; n = 3 mice per group. Error bars represent SEM. **, P < 0.01. P-values were calculated using Student’s t test.
Figure 5.
Figure 5.
Anti-tumor effect of T reg cell ablation requires CD4+ T cells and IFN-γ, but not CD8+ or NK cells. (A–E) Growth kinetics of orthotopically implanted tumors in mice treated with 25 µg/kg DT at indicated times, in combination with 1 mg IFN-γ (A) or 300 µg NK1.1 antibody (B) on day 10, 250 µg CD8 antibody on day 13 (C), or 100 µg CD4 antibody on day 10 (E). Blue arrows indicate antibody treatment. Red arrows indicate DT injection. (D) Tumor growth kinetics of control or DT-treated β2M−/− Foxp3DTR mice. A representative of two independent experiments is shown; n = 5 mice per group. Error bars represent SEM. *, P < 0.05. P-values were calculated using ANOVA followed by Bonferroni’s post-hoc test.
Figure 6.
Figure 6.
Checkpoint blockade does not affect oncogene-driven tumor growth and lung metastasis, nor does it cooperate with T reg cell ablation. (A) Diagram of experimental set up. Green arrows indicate injection of 25 µg/kg DT, blue arrows indicate injection of specific antibody, and black arrows indicate day of tumor implantation (↓) and analysis (↑). (B) Expression of PD-1 and PD-L1 on CD4+ T cells (left) and CD11B+ cells (right) in control (top) and DT-treated tumors (bottom) assessed by flow cytometry. (C and E) Tumor growth kinetics of orthotopically implanted PyMT-driven mammary carcinomas. Mice were treated with 0.1 mg CTLA-4 (C) or 0.25 mg PD-1 + 0.1 mg PD-L1 antibodies (E) on days 0, 3, and 6 after tumors reached a volume of ∼100 mm3 after implantation of 105 tumor cells in the mammary fat pad of 6–8-wk-old female virgin mice. 25 µg/kg DT was injected intravenously on days −1 and 0 of initial antibody treatment. One representative of two independent experiments, n = 5 mice per group. (D and F) Number of metastatic nodules present on the lung surface quantified upon examination under a dissecting microscope. Error bars represent SEM. ***, P < 0.001; ****, P < 0.0001 P-values were calculated using ANOVA followed by Bonferroni’s post-hoc test.
Figure 7.
Figure 7.
T reg cell ablation improves the effect of ionizing radiation on tumor growth. (A) Scheme of treatment. 12Gy of ionizing radiation was delivered in a single fraction when tumors reached a volume of ∼100 mm3 (green arrow), followed by two i.v. injections of 25 µg/kg DT (blue arrows). Orthotopic tumor transplantation is indicated by a black arrow (↓). (B) Tumor growth kinetics in mice subjected to radiation alone, DT-mediated T reg cell ablation alone, a combination of both, or no treatment. ****, P < 0.0001. (C) Analysis of fold change increase in tumor size for each group at day 27 after initial treatment. **, P < 0.01; ***, P < 0.001; ****, P < 0.0001. (D) Day at which a given tumor reaches a volume of at least 1,000 mm3. n.s., not significant; *, P < 0.05; ***, P < 0.001; ****, P < 0.0001. (E) Representative images of histological staining with cleaved Caspase 3, depicting the area of apoptotic cells observed in each individual tumor. n = 3–5 mice per group. Bar, 5,000 µm. (F) Histological assessment of the number of CD45+ IBA1+ cells in representative viable regions of the tumor. *, P < 0.05; ***, P < 0.001. (G) Survival analysis of mice in each of the animal groups described above. *, P < 0.05; **, P < 0.01. (H) Time-matched quantification of metastatic nodules in lungs from mice in each group. ***, P < 0.001. A representative of two independent experiments is shown; n = 5 mice per group. Error bars represent SEM. P-values were calculated using ANOVA followed by Bonferroni’s post-hoc test.

References

    1. Ascierto P.A., Kalos M., Schaer D.A., Callahan M.K., Wolchok J.D. 2013. Biomarkers for immunostimulatory monoclonal antibodies in combination strategies for melanoma and other tumor types. Clin. Cancer Res. 19:1009–1020 10.1158/1078-0432.CCR-12-2982 - DOI - PubMed
    1. Balachandran V.P., Cavnar M.J., Zeng S., Bamboat Z.M., Ocuin L.M., Obaid H., Sorenson E.C., Popow R., Ariyan C., Rossi F., et al. 2011. Imatinib potentiates antitumor T cell responses in gastrointestinal stromal tumor through the inhibition of Ido. Nat. Med. 17:1094–1100 10.1038/nm.2438 - DOI - PMC - PubMed
    1. Barber D.L., Wherry E.J., Masopust D., Zhu B., Allison J.P., Sharpe A.H., Freeman G.J., Ahmed R. 2006. Restoring function in exhausted CD8 T cells during chronic viral infection. Nature. 439:682–687 10.1038/nature04444 - DOI - PubMed
    1. Brahmer J.R., Tykodi S.S., Chow L.Q., Hwu W.J., Topalian S.L., Hwu P., Drake C.G., Camacho L.H., Kauh J., Odunsi K., et al. 2012. Safety and activity of anti-PD-L1 antibody in patients with advanced cancer. N. Engl. J. Med. 366:2455–2465 10.1056/NEJMoa1200694 - DOI - PMC - PubMed
    1. Chen L., Flies D.B. 2013. Molecular mechanisms of T cell co-stimulation and co-inhibition. Nat. Rev. Immunol. 13:227–242 10.1038/nri3405 - DOI - PMC - PubMed

Publication types

MeSH terms

Substances