. 2013 Oct 21;210(11):2191-204.
doi: 10.1084/jem.20130028. Epub 2013 Oct 14.

Transcription repressor Bach2 is required for pulmonary surfactant homeostasis and alveolar macrophage function

Affiliations

Transcription repressor Bach2 is required for pulmonary surfactant homeostasis and alveolar macrophage function

Atsushi Nakamura et al. J Exp Med. .

Abstract

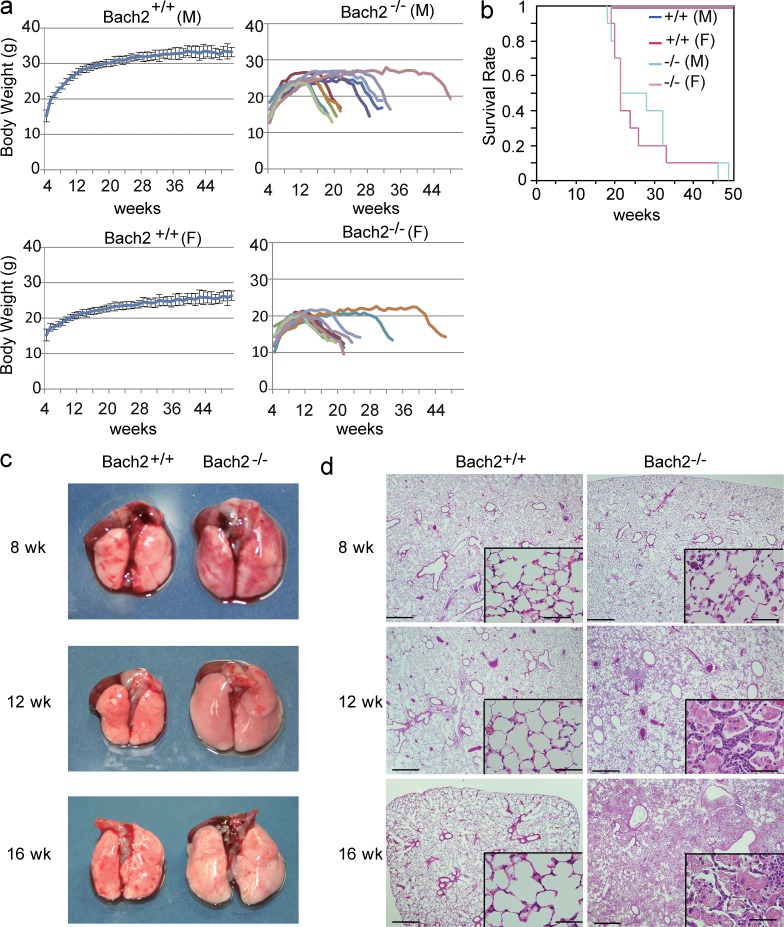
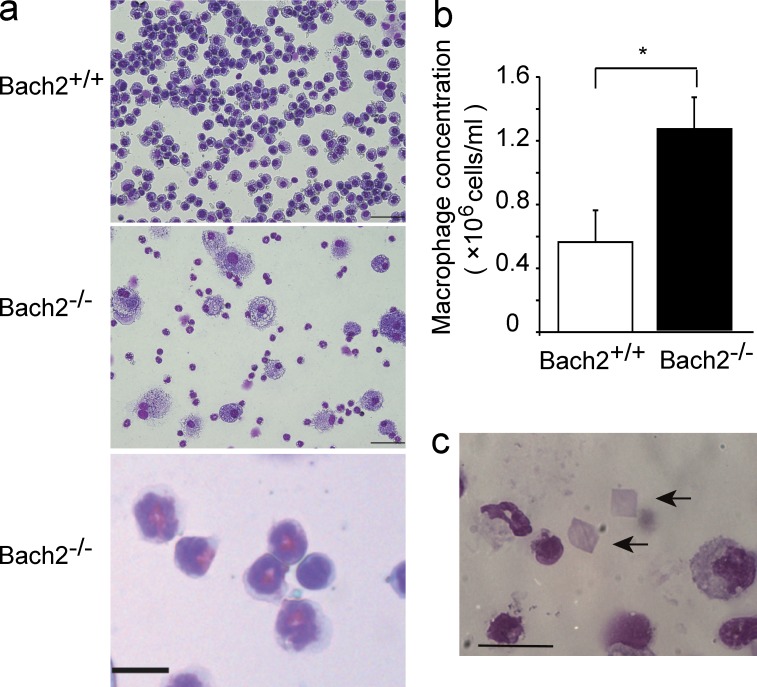
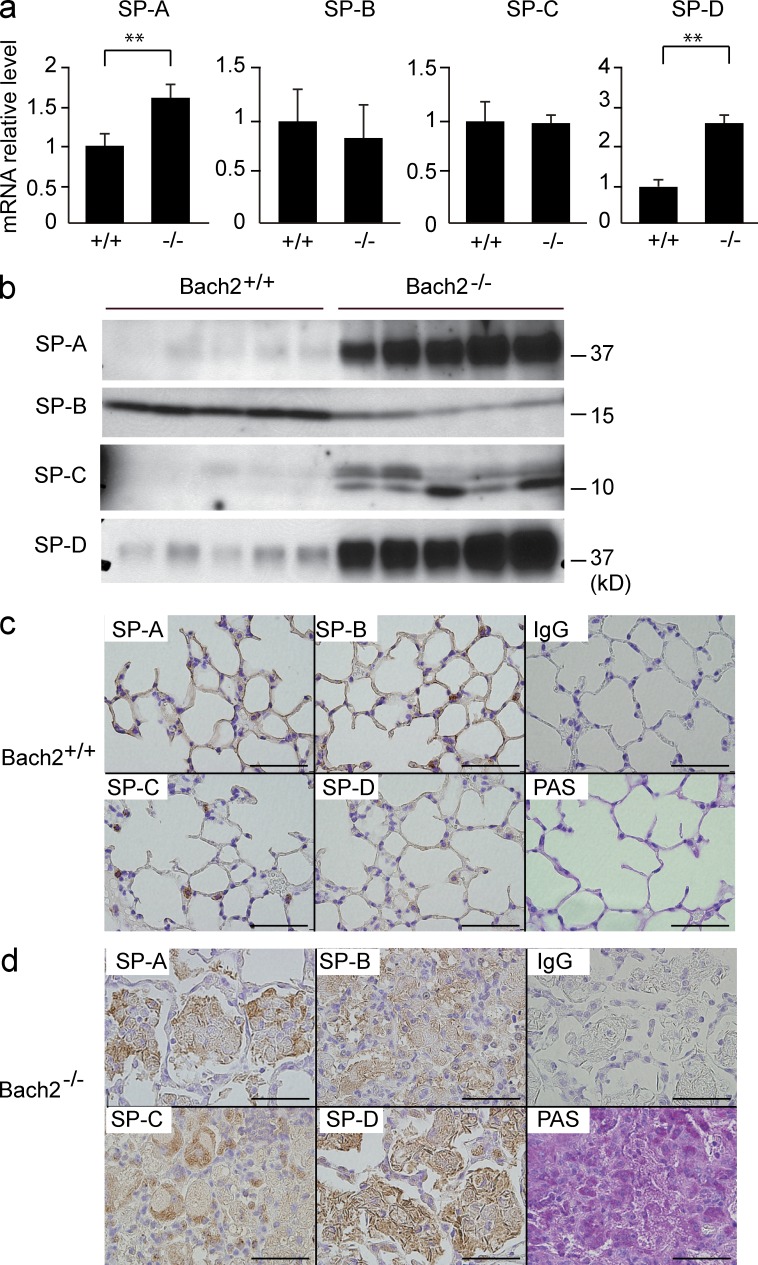
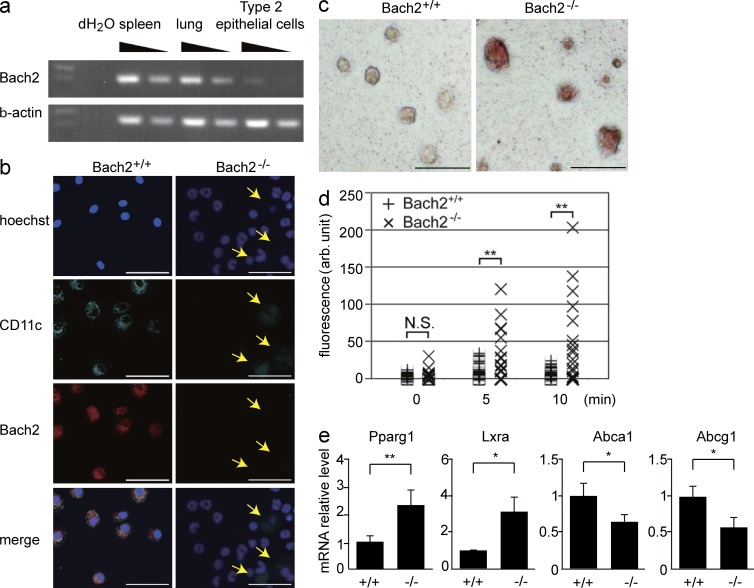
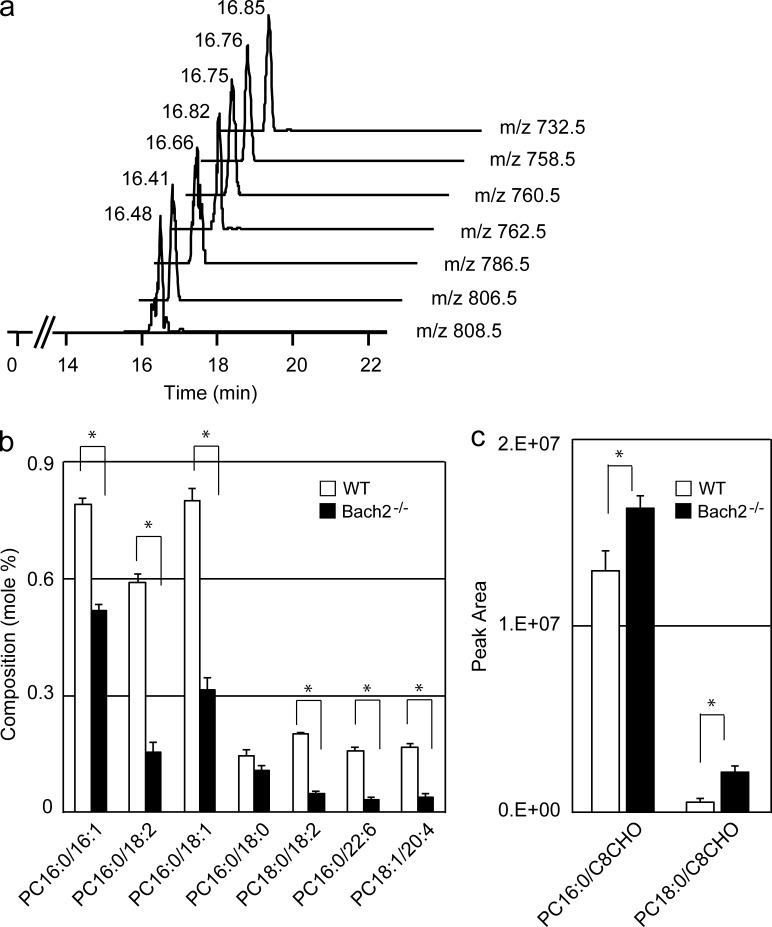
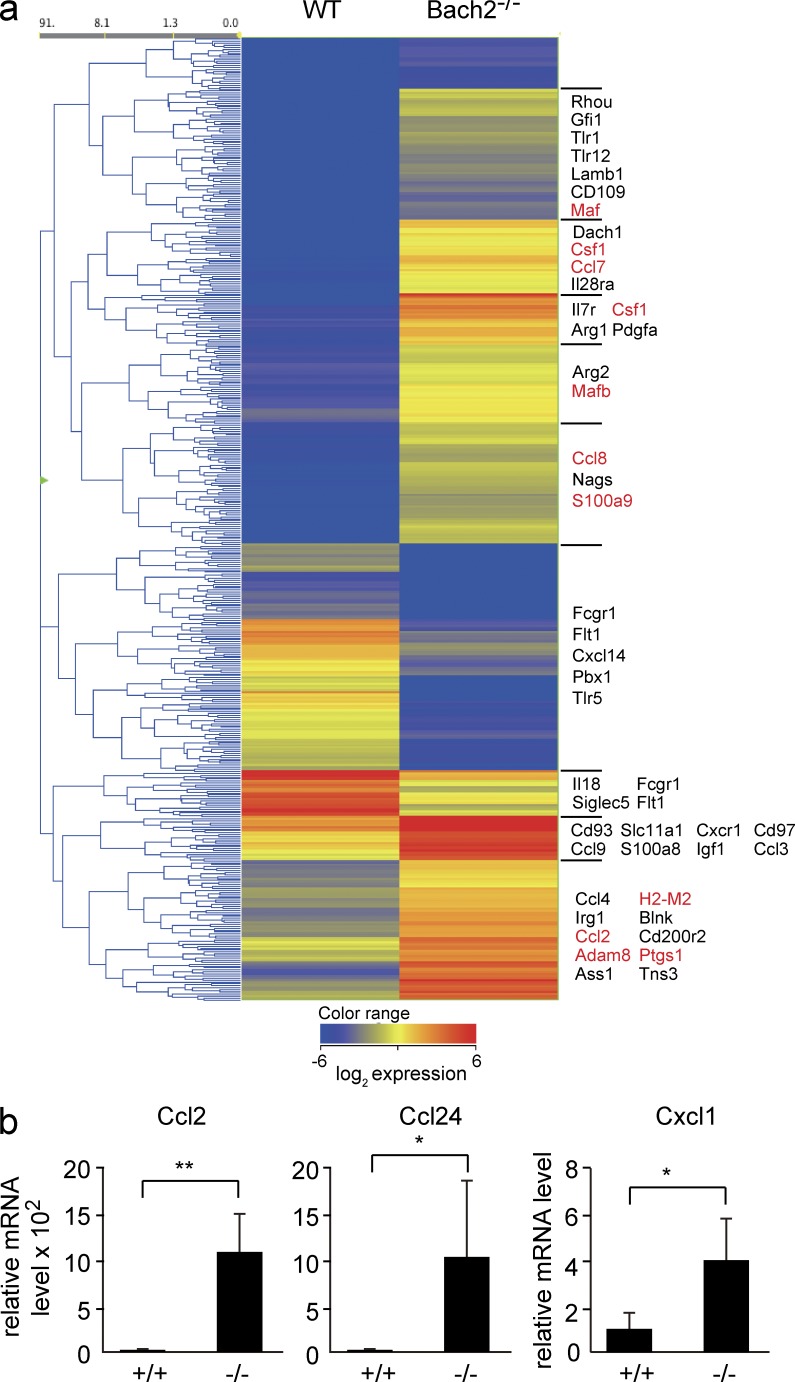
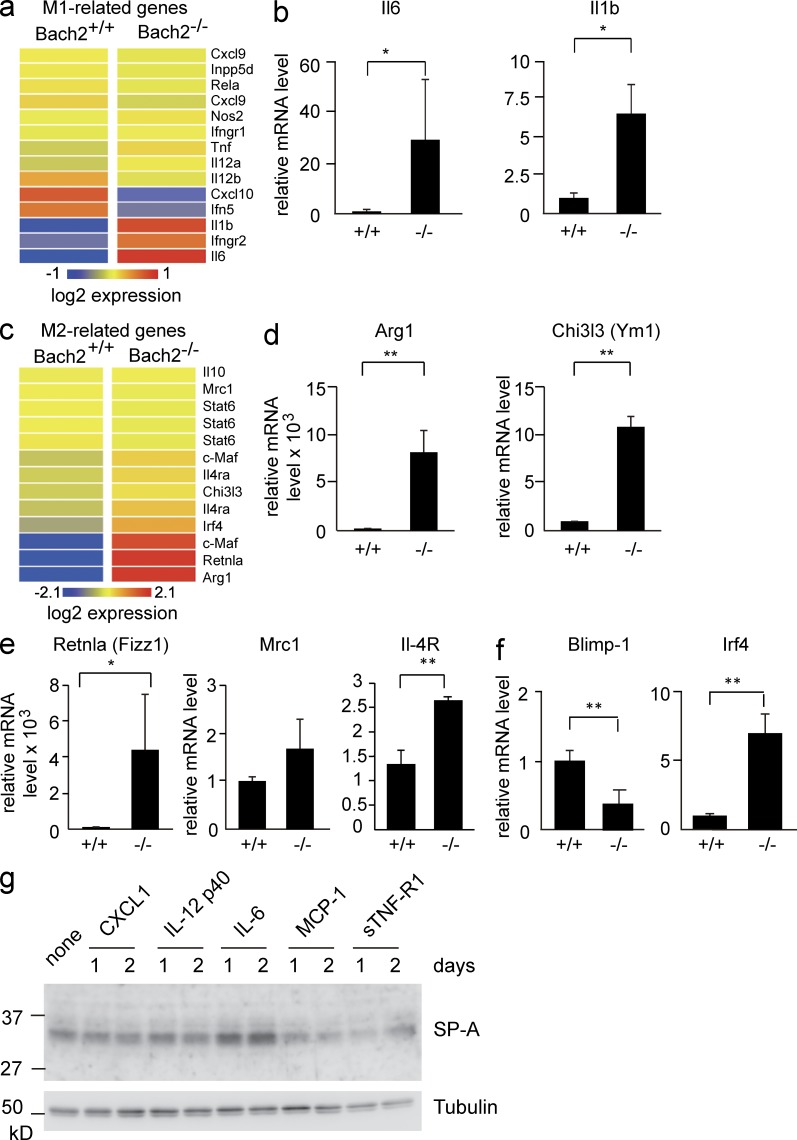
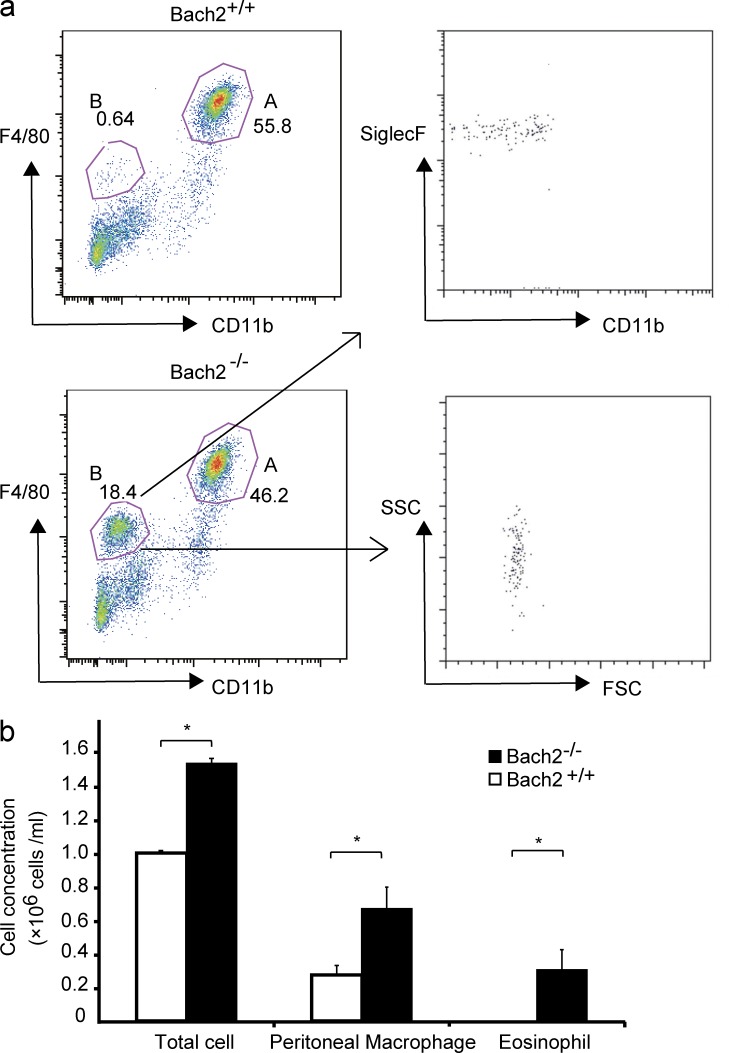
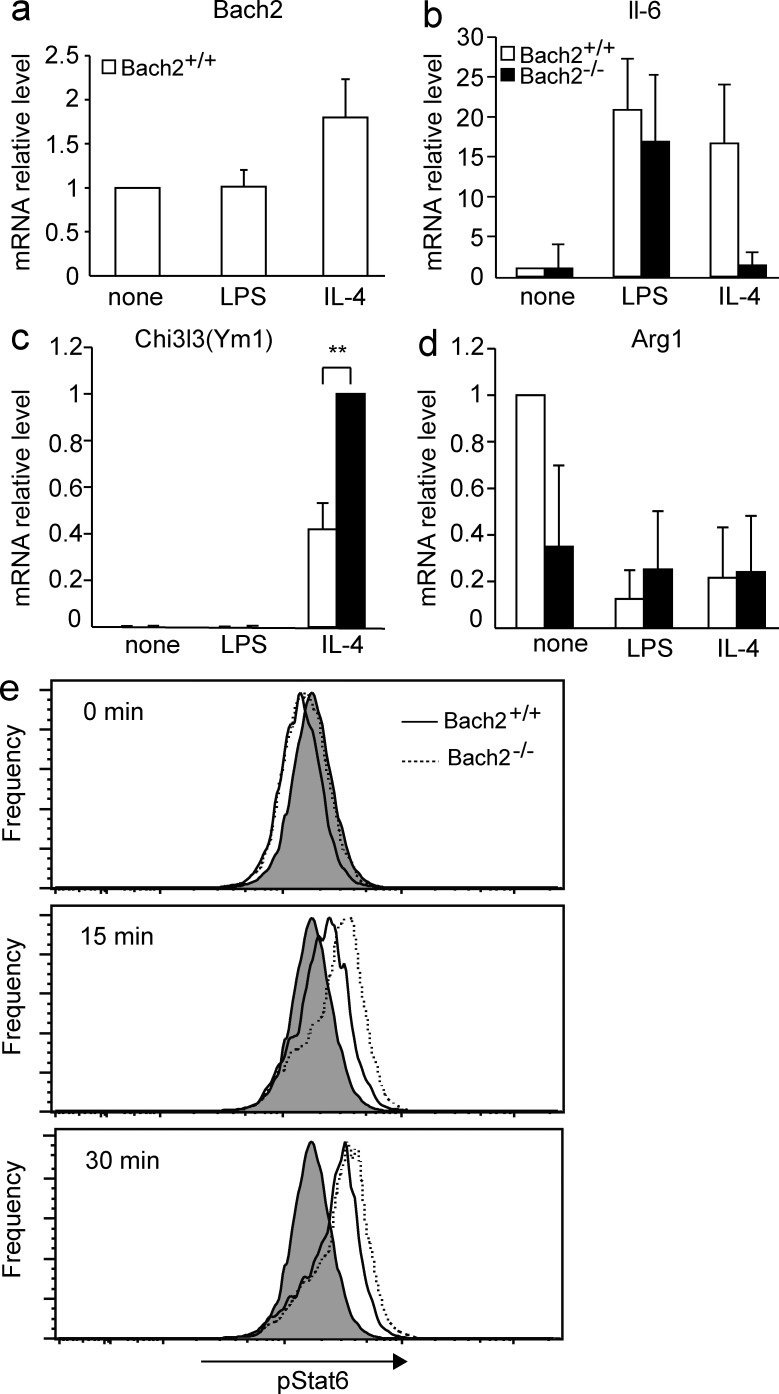
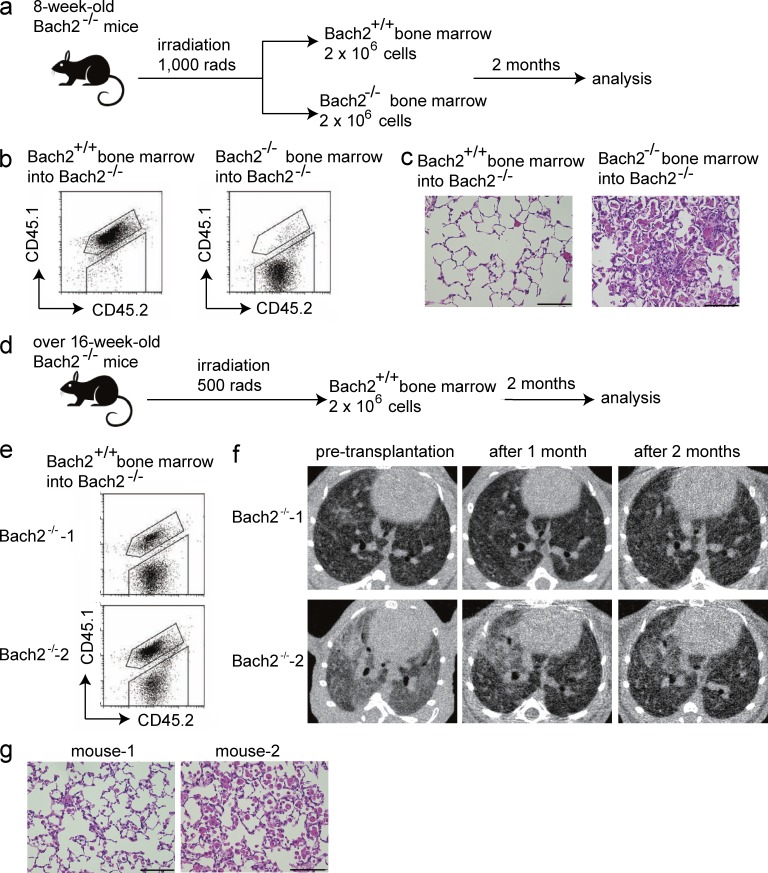
Pulmonary alveolar proteinosis (PAP) results from a dysfunction of alveolar macrophages (AMs), chiefly due to disruptions in the signaling of granulocyte macrophage colony-stimulating factor (GM-CSF). We found that mice deficient for the B lymphoid transcription repressor BTB and CNC homology 2 (Bach2) developed PAP-like accumulation of surfactant proteins in the lungs. Bach2 was expressed in AMs, and Bach2-deficient AMs showed alterations in lipid handling in comparison with wild-type (WT) cells. Although Bach2-deficient AMs showed a normal expression of the genes involved in the GM-CSF signaling, they showed an altered expression of the genes involved in chemotaxis, lipid metabolism, and alternative M2 macrophage activation with increased expression of Ym1 and arginase-1, and the M2 regulator Irf4. Peritoneal Bach2-deficient macrophages showed increased Ym1 expression when stimulated with interleukin-4. More eosinophils were present in the lung and peritoneal cavity of Bach2-deficient mice compared with WT mice. The PAP-like lesions in Bach2-deficient mice were relieved by WT bone marrow transplantation even after their development, confirming the hematopoietic origin of the lesions. These results indicate that Bach2 is required for the functional maturation of AMs and pulmonary homeostasis, independently of the GM-CSF signaling.


Figures

Figure 1.
Figure 1.
PAP-like disease in Bach2-deficient mice. (a) The body weight curves of WT and Bach2-deficient male and female mice (n = 10/group). The data from the WT mice are shown as the mean with the SD, whereas the data from Bach2-deficient mice are shown individually because Bach2-deficient mice showed individual variability in body weight and longevity. (b) The survival curves of WT and Bach2-deficient mice. WT male (M) and female (F) mice were combined. The curves for Bach2-deficient male (light blue, n = 10) and female (pink, n = 10) mice are shown separately. (c) The macroscopic appearance of the lungs of WT and Bach2-deficient mice at indicated time points. (d) HE staining of paraffin-embedded lungs from the WT and Bach2-deficient mice. Bars: 500 µm; (insets) 50 µm.
Figure 2.
Figure 2.
PAP-like disease in Bach2-deficient mice. (a) May-Giemsa staining of BAL cells from WT and Bach2-deficient mice. Bars, 100 µm. An enlarged panel is at the bottom to show eosinophils (bar, 10 µm). (b) Cell concentrations of AMs in BAL fluids from WT and Bach2-deficient mice. The mean values from five mice for each group are shown. Error bars represent SD. P-values were obtained by two-tailed Student’s t-tests. *, P < 0.05. (c) Crystal polygons (arrows) in the BAL fluid from Bach2-deficient mice. Bar, 20 µm.
Figure 3.
Figure 3.
The accumulation of SPs in Bach2-deficient lungs. (a) The mRNA levels of SP-A, -B, -C, and -D in the lungs were determined by quantitative RT-PCR. mRNA of β-Actin was used as a normalization control. The mean values from five mice for each group are shown. P-values were obtained by two-tailed Student’s t-tests. Error bars represent SD. **, P < 0.01. (b) SPs were compared by Western blot analysis of the BAL fluids from WT and Bach2-deficient mice (n = 5). (c and d) An immunohistochemical analysis of WT (c) and Bach2-deficient (d) lungs using antibodies against SP-A, -B, -C, -D, or control IgG. The results of PAS staining are also shown. Bars, 50 µm.
Figure 4.
Figure 4.
Bach2-deficient AMs show defects in phagocytosis and cholesterol handling. (a) The Bach2 expression in the spleen, lung, and alveolar type 2 epithelial cells was determined by semi-quantitative RT-PCR. β-Actin mRNA was used as a normalization control. (b) The Bach2 expression in BAL cells was examined by immunofluorescence staining. Hoechst (blue), CD11c (green), Bach2 (red), and merged images are shown. The CD11c-positive cells (arrows) were AMs. Bars, 50 µm. (c) Oil-Red O staining of AMs from WT and Bach2-deficient AMs. The experiments were performed independently three times (bars, 100 µm). (d) Uptake of cholesterol by indicated AMs was determined and shown as relative fluorescence intensities per cell. P-values were obtained by two-tailed Student’s t-tests. **, P < 0.01; N.S., nonsignificant. (e) The mRNA levels of Pparγ1, Lxrα, Abca1, and Abcg1 in sorted AMs were determined by quantitative RT-PCR. β-Actin expression was used as a normalization control. The mean values from WT (n = 3) and Bach2-deficient (n = 4) AMs are shown. The error bars represent SD. P-values were obtained by two-tailed Student’s t tests. **, P < 0.01; *, P < 0.05.
Figure 5.
Figure 5.
Bach2-deficient AMs show alterations in lipid handling. (a) PC16:0/16:1, PC16:0/18:2, PC16:0/18:1, PC16:0/18:2, PC18:0/18:1, PC16:0/22:6, and PC18:1/20:4 were assigned from the value of m/z 732.5, 758.5, 760.5, 762.5, 786.5, 806.5, and 808.5. (b and c) The composition of representative spices of PCs (b) and oxidized PCs (oxPCs; c) were compared between AMs isolated from WT and Bach2-deficient mice. OxPCs: PC16:0/C8CHO and PC18:0/C8CHO were assigned from the value of m/z 650.5 and 678.5, respectively. The values of PCs and oxPCs were presented by their peak ratio using TSQ Quantum Ultra and peak area using Q Exactive, respectively, and expressed as mean ± SD. Statistical analysis were performed using a Student’s t test for comparisons between the two genetic backgrounds, and values of P < 0.05 (*) were considered statistically significant.
Figure 6.
Figure 6.
The gene expression profile of Bach2-deficient AMs. (a) The heat-map of genes showing >10-fold changes in expression between WT and Bach2−/− AMs. Genes involved in cytokine signaling, chemotaxis, lipid metabolism, arginine metabolism, and gene expression are arbitrarily shown. (b) The mRNA levels of Ccl2, Ccl24, and Cxcl1 in sorted AMs were determined by quantitative RT-PCR. β-Actin mRNA was used as the normalization control. The mean values were shown from WT (n = 3) and Bach2-deficient (n = 4) AMs. The error bars represent SD. The p-values were obtained by two-tailed (Ccl2 and Cxcl1) or one-tailed (Ccl24) Student’s t tests. **, P < 0.01; *, P < 0.05.
Figure 7.
Figure 7.
Expression of M1- and M2-related genes in Bach2-deficient AMs. (a) The heat-map of M1-related genes. (b) The mRNA levels of Il-6 and Il-1b in sorted AMs were determined by quantitative RT-PCR. (c) The heat-map of M2-related genes. (d and e) The mRNA levels of Arg1, Ym1, Fizz1, Mrc1, and IL-4R in sorted AMs were determined by quantitative RT-PCR. (f) The mRNA levels of Blimp-1 and Irf4 in sorted AMs were determined by quantitative RT-PCR. (b and d–f) β-Actin mRNA was used as the normalization control. The mean values were shown from WT (n = 3) and Bach2-deficient (n = 4) AMs. The error bars represent SD. The p-values were obtained by two-tailed Student’s t tests, except Il6 and Retnla (one-tailed tests). *, P < 0.05; **, P < 0.01. (g) H441 lung adenocarcinoma cells were treated with the indicated reagents for 1 or 2 d, and the levels of SP-A protein were determined by Western blot analysis. A representative result of two independent experiments is shown.
Figure 8.
Figure 8.
Bach2-deficient mice contained more macrophages and eosinophils in peritoneal cavity. (a) The flow cytometric analysis of peritoneal cells isolated from indicated mice. Gates A and B contained macrophages and eosinophils, respectively. (b) The concentrations of total cells, macrophages, and eosinophils in the peritoneal cavity of indicated mice. Results were obtained using three mice per genotypes. The p-values were obtained by two-tailed Student’s t tests. The error bars represent SD. *, P < 0.05.
Figure 9.
Figure 9.
Expression of M1- and M2-related genes in Bach2-deficient peritoneal macrophages. Peritoneal macrophages were stimulated with indicated reagents for 48 h in vitro. The mRNA levels of Bach2 (a), IL-6 (b), Ym1 (c), and Arg1 (d) in the macrophages isolated from indicated mice were determined by quantitative RT-PCR. β-Actin mRNA was used as the normalization control. The mean values were shown (n = 4). The error bars represent SD. The p-values were obtained by two-tailed Student’s t tests. **, P < 0.01. (e) Intracellular staining of indicated BMDMs was performed using phosphorylated STAT6 antibody after the stimulation with IL-4 for indicated periods. Signal intensities were analyzed using flow cytometer and shown. Staining with control isotype antibody is shown as gray plots. Representative results of two independent experiments are shown.
Figure 10.
Figure 10.
The expression of Bach2 in hematopoietic cells is essential for pulmonary homeostasis. (a) The protocol for the BM transplantation to examine the effects on PAP. The experiments were performed using three mice for each group. (b) The flow cytometric analysis of peripheral blood cells to confirm the success of the transplant. (c) The histological examination (HE staining) of the lungs 2 mo after BM transplantation. Bars, 100 µm. (d) The protocol for the BM transplantation to examine the therapeutic effects. Because Bach2-deficient mice over 16 wk of age had become weakened, we applied only 500 rads during the irradiation of these mice. The experiments were performed using two Bach2-deficient mice. (e) The flow cytometric analysis of the peripheral blood cells to confirm the transplantation. (f) The CT images of the lungs of Bach2-deficient mice before and after the transplantation. (g) The histological examination (HE staining) of the lungs 2 mo after the BM transplantation. Bars, 100 µm.

References

    1. Ando J., Tamayose K., Sugimoto K., Oshimi K. 2002. Late appearance of t(1;19)(q11;q11) in myelodysplastic syndrome associated with dysplastic eosinophilia and pulmonary alveolar proteinosis. Cancer Genet. Cytogenet. 139:14–17 10.1016/S0165-4608(02)00652-0 - DOI - PubMed
    1. Baker A.D., Malur A., Barna B.P., Ghosh S., Kavuru M.S., Malur A.G., Thomassen M.J. 2010. Targeted PPARgamma deficiency in alveolar macrophages disrupts surfactant catabolism. J. Lipid Res. 51:1325–1331 10.1194/jlr.M001651 - DOI - PMC - PubMed
    1. Bates S.R., Tao J.Q., Collins H.L., Francone O.L., Rothblat G.H. 2005. Pulmonary abnormalities due to ABCA1 deficiency in mice. Am. J. Physiol. Lung Cell. Mol. Physiol. 289:L980–L989 10.1152/ajplung.00234.2005 - DOI - PubMed
    1. Blanchard P.G., Festuccia W.T., Houde V.P., St-Pierre P., Brûlé S., Turcotte V., Côté M., Bellmann K., Marette A., Deshaies Y. 2012. Major involvement of mTOR in the PPARγ-induced stimulation of adipose tissue lipid uptake and fat accretion. J. Lipid Res. 53:1117–1125 10.1194/jlr.M021485 - DOI - PMC - PubMed
    1. Bonfield T.L., Farver C.F., Barna B.P., Malur A., Abraham S., Raychaudhuri B., Kavuru M.S., Thomassen M.J. 2003. Peroxisome proliferator-activated receptor-gamma is deficient in alveolar macrophages from patients with alveolar proteinosis. Am. J. Respir. Cell Mol. Biol. 29:677–682 10.1165/rcmb.2003-0148OC - DOI - PubMed

Publication types

MeSH terms

Substances