. 2013 Oct 29;110(44):17945-50.
doi: 10.1073/pnas.1316796110. Epub 2013 Oct 14.

Anti-CCR4 mAb selectively depletes effector-type FoxP3+CD4+ regulatory T cells, evoking antitumor immune responses in humans

Affiliations

Anti-CCR4 mAb selectively depletes effector-type FoxP3+CD4+ regulatory T cells, evoking antitumor immune responses in humans

Daisuke Sugiyama et al. Proc Natl Acad Sci U S A. .

Abstract

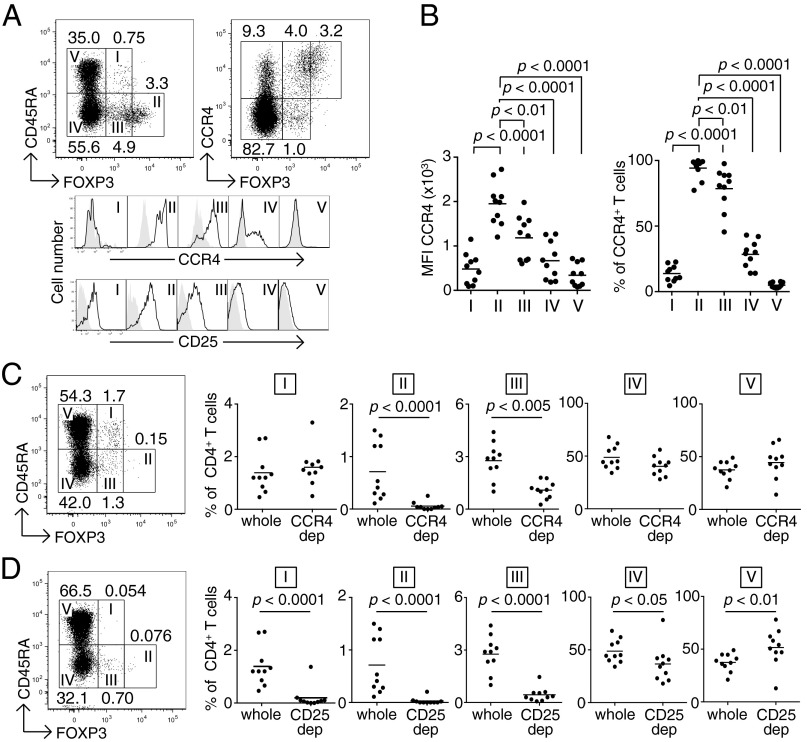
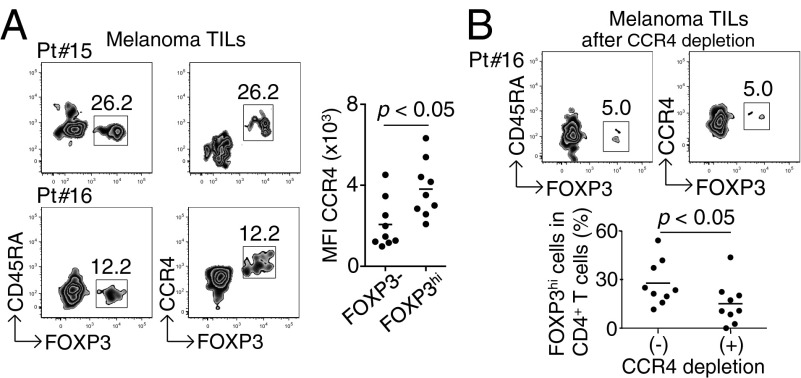
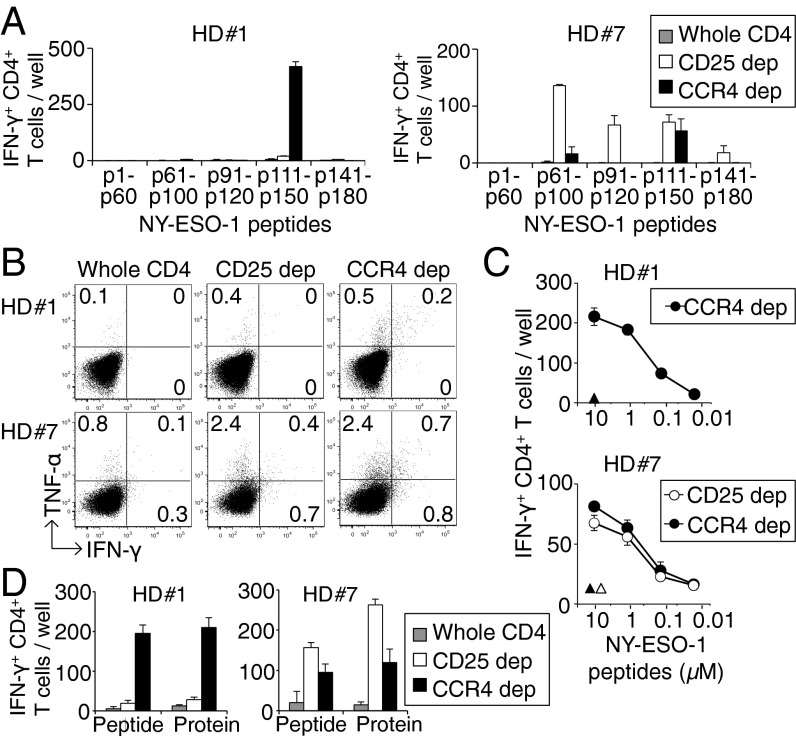
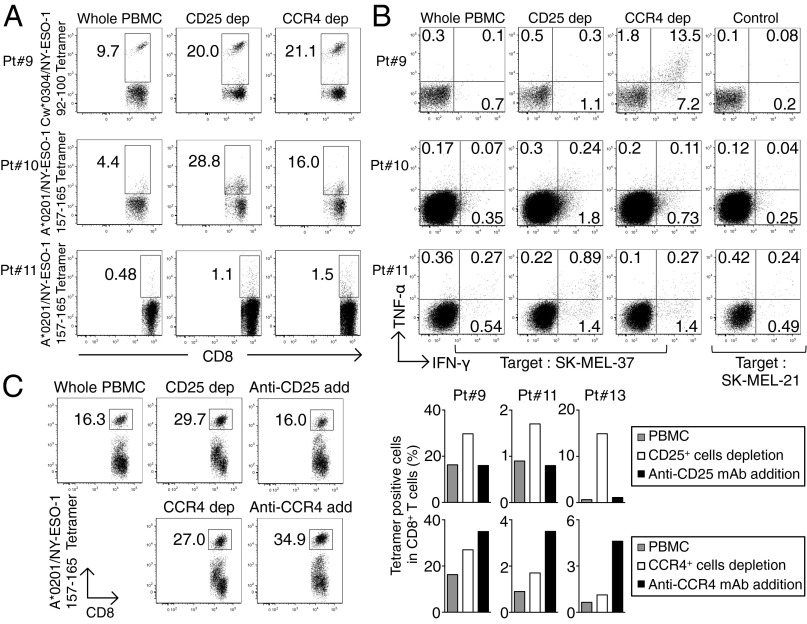
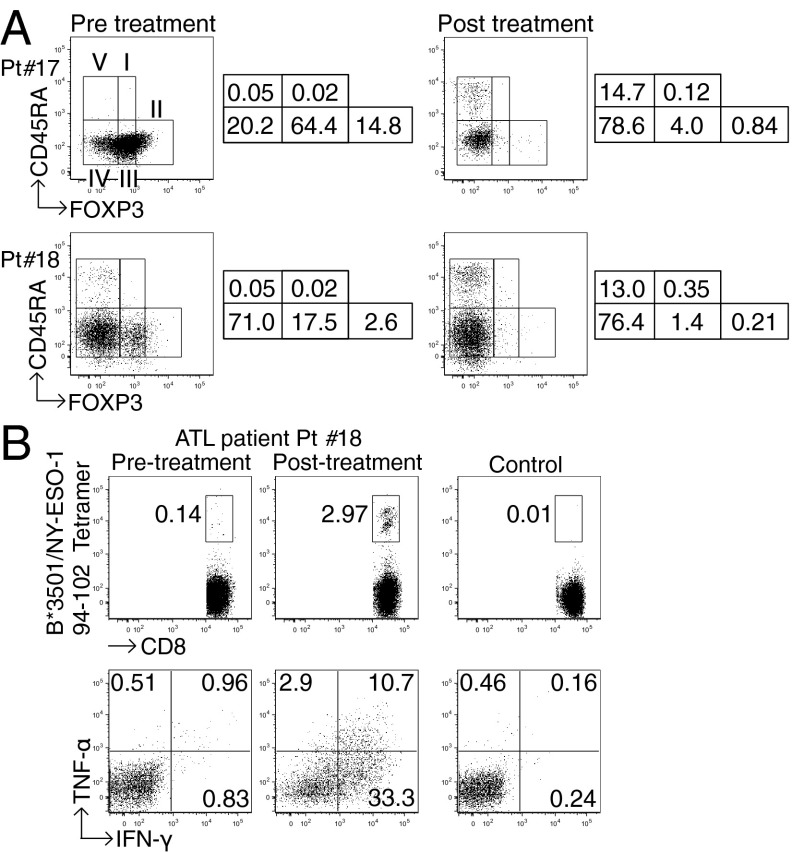
CD4(+) Treg cells expressing the transcription factor FOXP3 (forkhead box P3) are abundant in tumor tissues and appear to hinder the induction of effective antitumor immunity. A substantial number of T cells, including Treg cells, in tumor tissues and peripheral blood express C-C chemokine receptor 4 (CCR4). Here we show that CCR4 was specifically expressed by a subset of terminally differentiated and most suppressive CD45RA(-)FOXP3(hi)CD4(+) Treg cells [designated effector Treg (eTreg) cells], but not by CD45RA(+)FOXP3(lo)CD4(+) naive Treg cells, in peripheral blood of healthy individuals and cancer patients. In melanoma tissues, CCR4(+) eTreg cells were predominant among tumor-infiltrating FOXP3(+) T cells and much higher in frequency compared with those in peripheral blood. With peripheral blood lymphocytes from healthy individuals and melanoma patients, ex vivo depletion of CCR4(+) T cells and subsequent in vitro stimulation of the depleted cell population with the cancer/testis antigen NY-ESO-1 efficiently induced NY-ESO-1-specific CD4(+) T cells. Nondepletion failed in the induction. The magnitude of the responses was comparable with total removal of FOXP3(+) Treg cells by CD25(+) T-cell depletion. CCR4(+) T-cell depletion also augmented in vitro induction of NY-ESO-1-specific CD8(+) T cells in melanoma patients. Furthermore, in vivo administration of anti-CCR4 mAb markedly reduced the eTreg-cell fraction and augmented NY-ESO-1-specific CD8(+) T-cell responses in an adult T-cell leukemia-lymphoma patient whose leukemic cells expressed NY-ESO-1. Collectively, these findings indicate that anti-CCR4 mAb treatment is instrumental for evoking and augmenting antitumor immunity in cancer patients by selectively depleting eTreg cells.

Keywords: cancer immunotherapy; immunomodulation.


Conflict of interest statement

Conflict of interest statement: H.N. received a research grant from Kyowa Hakko Kirin Co., Ltd.

Figures

Fig. 1.
Fig. 1.
Reduction of eTreg cells by in vitro depletion of CCR4-expressing T cells. (A) CCR4 and CD25 expression by subpopulations of FOXP3+ Treg cells in PBMCs from healthy donors. CCR4 and CD25 expression levels were evaluated for each fraction. Representative data from 10 healthy donors are shown. (B) Median fluorescence intensity (MFI, Left) and frequency (Right) of CCR4 expression by each fraction of T cells in PBMCs of healthy donors (n =10). (C) Changes in the proportion of T-cell subpopulations after CCR4+ T-cell depletion (CCR4 dep) (n = 10). (D) Changes in the proportion of T-cell subpopulations after CD25+ T-cell depletion (CD25 dep) (n = 10). The numbers in A, C, and D indicate the percentage of gated CD4+ T cells. Representative staining profiles in A, C, and D are from the same donor, and the same PBMC samples were analyzed in BD.
Fig. 2.
Fig. 2.
Predominant infiltration of CCR4+ eTreg cells into melanoma tissues. (A) CCR4 expression by melanoma-infiltrating T cells. CD4+ T cells from melanoma sites were fractionated into subpopulations based on the expression of CCR4, CD45RA, and FOXP3; CCR4 expression by each fraction was analyzed. Data from two representative patients are shown. (Right) Summary of MFI of CCR4 expression by FOXP3 or FOXP3+ cells (n = 9). (B) CCR4+CD4+ T cells from melanoma tissues (Pt #16) were depleted of CCR4+ T cells and then analyzed for the proportion of FOXP3hi eTreg cells. (Lower) Percentages of FOXP3hi cells among CD4+ T cells after CCR4+ cell depletion or nondepletion (n = 9). The numbers in A and B indicate the percentage of gated CD4+ T cells.
Fig. 3.
Fig. 3.
Induction of cancer/testes antigen-specific CD4+ T cells by depletion of CCR4- or CD25-expressing T cells in healthy donors. (A) CD4+ T-cell responses to NY-ESO-1 peptides after depletion of CCR4+ or CD25+ T cells. CD4+ T cells prepared from PBMCs of healthy donors were presensitized with APCs pulsed with NY-ESO-1 peptide covering the entire sequence of NY-ESO-1. Results of 2 (HD#1 and HD#7) among 16 healthy donors are shown. The numbers of IFN-γ–secreting CD4+ T cells were assessed by ELISpot assay. (B) Intracellular cytokine secretion of CD4+ T cells shown in A. The numbers in figures indicate the percentage of gated CD4+ T cells. (C) Peptide dose-dependent recognition of NY-ESO-1–specific IFN-γ–secreting CD4+ T cells. NY-ESO-1–specific CD4+ T cells derived from CCR4+ or CD25+ T-cell–depleted cells (CCR4 dep and CD25 dep, respectively) were cultured with autologous activated T-cell APCs pulsed with graded amounts of NY-ESO-1 peptides and assessed for the number of IFN-γ–secreting cells as in A. Triangles indicate responses to control peptide at 10 μM. (D) Recognition of naturally processed NY-ESO-1 protein antigen by NY-ESO-1–specific CD4+ T cells derived from whole CD4+, CCR4+ cell-depleted, or CD25+ cell-depleted cells. NY-ESO-1–specific CD4+ T cells from two healthy donors were cultured with autologous dendritic cells pulsed with NY-ESO-1 or control protein, or with NY-ESO-1 or control peptide. The experiments were independently performed twice with similar results.
Fig. 4.
Fig. 4.
Augmentation of NY-ESO-1–specific CD8+ T-cell induction in melanoma patients by in vitro CCR4+ T-cell depletion. (A) Induction of NY-ESO-1–specific CD8+ T cells. Unfractionated PBMCs, or PBMCs depleted of CD25+ or CCR4+ cells, were prepared from melanoma patients (n = 6), and presensitized in peptides capable of binding to patients’ HLA. NY-ESO-1–specific CD8+ T cells were analyzed with NY-ESO-1/HLA tetramers (Pt. #9: A*02/29, B*44/27, C*03/04, Pt. #10: A*02/11, B*35/44, C*04/05, and Pt. #11: A*02/-, B*13/18, C*06/07). (B) Cytokine secretion of NY-ESO-1–specific CD8+ T cells upon recognition of the HLA-A*0201+ melanoma cell line SK-MEL 37 (NY-ESO-1+), or SK-MEL-21 (NY-ESO-1) analyzed by intracellular cytokine staining. Data from three representative patients are shown. (C) Induction of antigen-specific CD8+ T cells by addition (add) of anti-CD25 or anti-CCR4 mAb (KM2160) to cell cultures, or by CCR4+ or CD25+ cell depletion or nondepletion, as shown in A (Pt. #13 A02/03, B07/41, C07/17). A representative result (Left) and summary of three melanoma patients (Right) are shown. The numbers in the panels indicate the percentage of gated CD8+ T cells. These experiments were performed independently at least twice with similar results.
Fig. 5.
Fig. 5.
Reduction of CD4+FOXP3hiCD45RA T cells and augmentation of NY-ESO-1–specific CD8+ T-cell responses in ATL patients after anti-CCR4 mAb (Mogamulizumab) therapy. (A) FOXP3+ Treg-cell subpopulations in PBMCs from two ATL patients (Pt. #17: acute type, HLA-A*2402/-, B*3901/5401, C*0102/0702 and Pt. #18: lymphoma type, HLA-A*0201/3101, B*3501/4002, C*0303/0401) before and after anti-CCR4 mAb therapy. These experiments were performed at least twice with similar results. The numbers indicate the percentage of gated CD4+ T cells. (B) Analysis of NY-ESO-1–specific CD8+ T-cell induction before and after anti-CCR4 mAb therapy. PBMCs from Pt. #18 were presensitized in the presence of APCs pulsed with NY-ESO-191–110 peptide corresponding to the patient’s HLA. NY-ESO-1–specific CD8+ T cells were detected with NY-ESO-1/HLA tetramers, and cytokine secretion of these NY-ESO-1–specific CD8+ T cells upon recognition of autologous activated T-cell APCs pulsed with NY-ESO-191–110 or control peptide was analyzed by intracellular cytokine staining. The numbers in figures indicate the percentage of gated CD8+ T cells. The result was derived from a single assay because of limited availability of the patient’s samples.

Comment in

References

    1. Sakaguchi S. Naturally arising CD4+ regulatory t cells for immunologic self-tolerance and negative control of immune responses. Annu Rev Immunol. 2004;22:531–562. - PubMed
    1. Sakaguchi S, Miyara M, Costantino CM, Hafler DA. FOXP3+ regulatory T cells in the human immune system. Nat Rev Immunol. 2010;10(7):490–500. - PubMed
    1. Kawakami Y, Rosenberg SA. Human tumor antigens recognized by T-cells. Immunol Res. 1997;16(4):313–339. - PubMed
    1. Scanlan MJ, Gure AO, Jungbluth AA, Old LJ, Chen YT. Cancer/testis antigens: An expanding family of targets for cancer immunotherapy. Immunol Rev. 2002;188:22–32. - PubMed
    1. Boon T, Coulie PG, Van den Eynde BJ, van der Bruggen P. Human T cell responses against melanoma. Annu Rev Immunol. 2006;24:175–208. - PubMed

Publication types

MeSH terms