
Chromatin stretch enhancer states drive cell-specific gene regulation and harbor human disease risk variants

Stephen C J Parker et al. Proc Natl Acad Sci U S A. .

Abstract

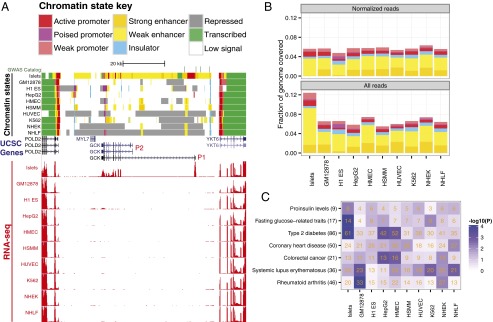
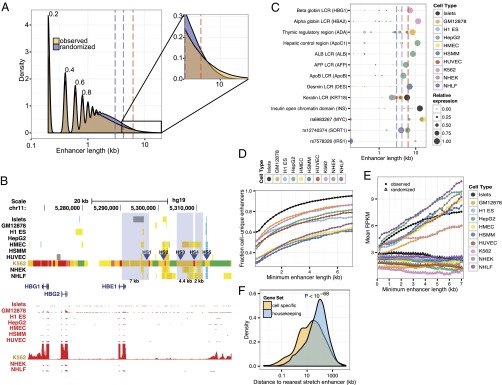
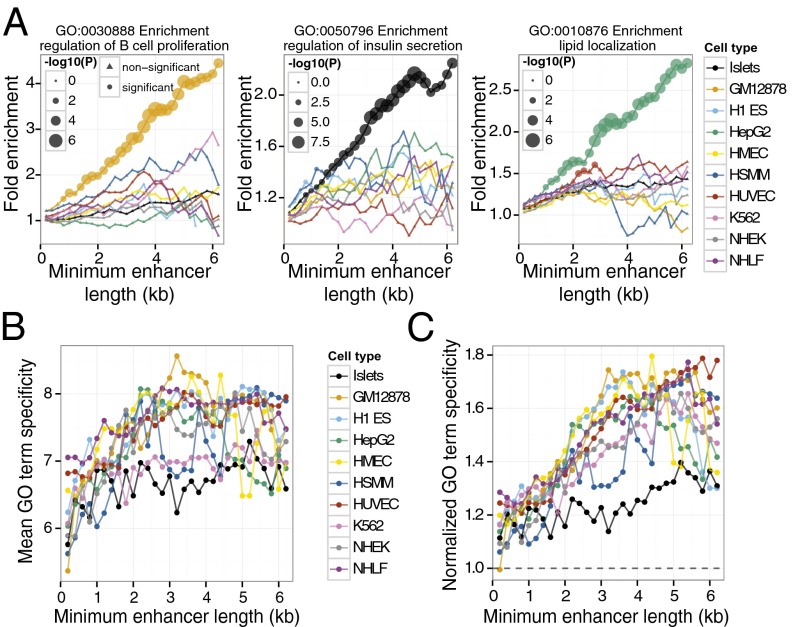
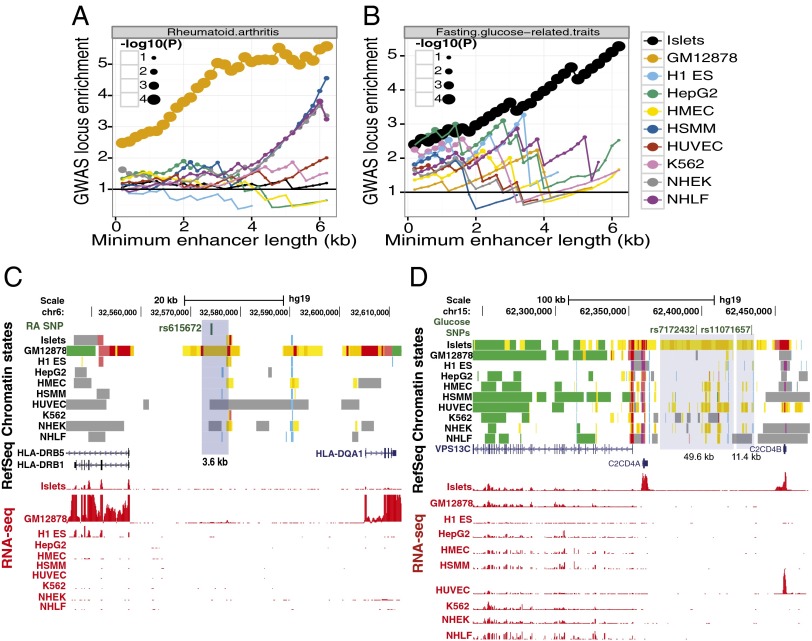
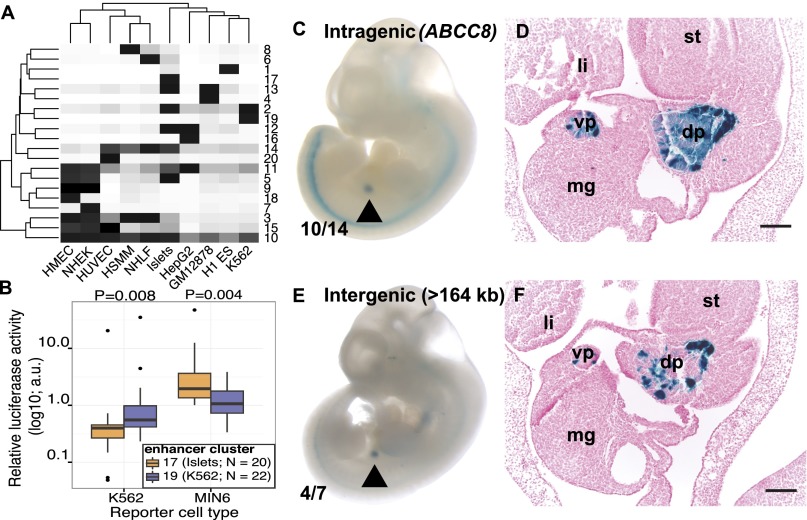
Chromatin-based functional genomic analyses and genomewide association studies (GWASs) together implicate enhancers as critical elements influencing gene expression and risk for common diseases. Here, we performed systematic chromatin and transcriptome profiling in human pancreatic islets. Integrated analysis of islet data with those from nine cell types identified specific and significant enrichment of type 2 diabetes and related quantitative trait GWAS variants in islet enhancers. Our integrated chromatin maps reveal that most enhancers are short (median = 0.8 kb). Each cell type also contains a substantial number of more extended (≥ 3 kb) enhancers. Interestingly, these stretch enhancers are often tissue-specific and overlap locus control regions, suggesting that they are important chromatin regulatory beacons. Indeed, we show that (i) tissue specificity of enhancers and nearby gene expression increase with enhancer length; (ii) neighborhoods containing stretch enhancers are enriched for important cell type-specific genes; and (iii) GWAS variants associated with traits relevant to a particular cell type are more enriched in stretch enhancers compared with short enhancers. Reporter constructs containing stretch enhancer sequences exhibited tissue-specific activity in cell culture experiments and in transgenic mice. These results suggest that stretch enhancers are critical chromatin elements for coordinating cell type-specific regulatory programs and that sequence variation in stretch enhancers affects risk of major common human diseases.


Conflict of interest statement

The authors declare no conflict of interest.

Figures

Fig. 1.
Fig. 1.
Systematic and simultaneous analysis of chromatin states and gene expression in human pancreatic islets and nine ENCODE cell types. (A) Chromatin states in and around the GCK locus. Human pancreatic islet chromatin states are similar to nine ENCODE cell types at commonly expressed flanking genes (POLD2 and YKT6) and unique at islet-specific expressed genes (GCK). (Upper) ChromHMM-defined chromatin states for each of 10 human cell types (islets; GM128278, lymphoblastoid cells; H1 ES, embryonic stem cells; HepG2, hepatocellular carcinoma; HMEC, mammary epithelial cells; HSMM, smooth muscle myoblasts; HUVEC, umbilical vein endothelial cells, K562, erythroleukemia cells, NHEK, keratinocytes; NHLF, lung fibroblasts). Chromatin state assignments are indicated in the key. (Lower) RNA-seq–based expression for each cell type is indicated in red and is measured in reads per million mapped reads (RPM) per base pair. Scale is from 0 to 2 for each cell type. Note the specific use of and expression from the β cell–specific upstream promoter of GCK (P1; red). SNPs associated with T2D and related quantitative traits are indicated in green in the GWAS catalog track and reside in our unique islet enhancers. All processed results are browsable and downloadable at http://research.nhgri.nih.gov/manuscripts/Collins/islet_chromatin/. (B) Chromatin state coverage is similar across cell types. Fraction of genome covered by each chromatin state is plotted. State assignment colors are as in A. Read depths were slightly higher for the islets, which were sequenced for comparison with the ENCODE data. (C) Islet enhancers show significant enrichment of GWAS SNPs for T2D and related quantitative traits. Positions of index and tightly linked (r2 ≥ 0.8) SNPs for different diseases or traits (y axis) were overlapped with those of enhancer states for each cell type (x axis). The number of SNP loci overlapping enhancer states in each cell type is indicated in orange. Blue shading indicates the significance of SNP locus enrichment relative to a null distribution (Materials and Methods). Notably, our analysis reproduced enrichment of lupus and rheumatoid arthritis SNPs in lymphoblastoid cell line enhancers and colorectal cancer SNPs in hepatocellular carcinoma cell line enhancers (2). The total number of GWAS loci for each trait is indicated in parentheses on the y axis.
Fig. 2.
Fig. 2.
Stretch enhancer properties. (A) Enhancer states exhibit a range of length distribution. Density plot of observed (yellow) and random (blue) distribution of enhancer state lengths for all cell types combined. Distribution for each cell type is shown in SI Appendix, Fig. S6. Periodicity in the plot is a function of the 200-bp window of the ChromHMM algorithm. (Inset) Small but substantial enrichment for large enhancer states at the tail of the distribution. Enhancer sizes for the 90th (blue dashed line), 95th (purple dashed line), and 99th (red dashed line) percentile of the random distribution are indicated for reference. (B) Human β globin LCR contains multiple stretch enhancers. Chromatin states (Upper) and expression profiles (RNA-seq, red) near the β globin LCR show K562-specific chromatin states and robust HBG1/2 and HBE1 expression. Hypersensitive sites (HS) 1–3 and 5 (blue arrowheads) reside in K562-specific enhancer states (orange/yellow), two of which qualify as stretch enhancers. Chromatin states are color-coded as in Fig. 1A. (C) Celebrity enhancer regions overlap stretch enhancers. LCRs (15) and the INS/TH/IGF2 open chromatin domain (33) are contained in the top 10% of enhancer state size in relevant cell types (e.g., hepatic control region in hepatocellular carcinoma, thymic regulatory region in lymphoblastoid cell lines). Recently reported GWAS enhancer regions (–21) also overlap stretch enhancers (see lower three rows). Colors of circles on the plot represent different cell types. Circle diameters indicate RNA-seq expression levels of the target gene relative to levels in the highest cell type, as indicated in the key. Dashed lines are the same as in A. (D) Cell type specificity of enhancer increases with length. Fraction of enhancers unique to a cell type is plotted against increasing enhancer length. (E) Nearby gene expression increases with enhancer length. Median RNA-seq expression (RPKM) of genes within 125 kb of enhancer states is plotted against increasing enhancer length. Filled circles denote observed mean expression. Empty triangles indicate mean expression levels from randomly assigned genes. (F) Cell-specific genes are close to stretch enhancers. The distance of cell-specific or housekeeping genes (Materials and Methods) to stretch enhancers in each cell type was measured and indicates that cell-specific genes are significantly closer (P < 10−68; Wilcoxon rank sum test) compared with housekeeping genes.
Fig. 3.
Fig. 3.
Stretch enhancers are linked to more specific GO terms. (A) Genes with cell type–specific functions occur near stretch enhancers. Cell type–specific GO terms exhibit progressive enrichment in relevant cell types with increasing enhancer length. Examples include regulation of B-cell proliferation in GM12878 (Left), regulation of insulin secretion in islets (Center), and lipid localization in HepG2 (Right). Each line color represents a different cell line as indicated in the key to Fig. 2. Size of the circle for each cell type indicates the statistical significance (Bonferroni-corrected P value; hypergeometric test) of GO term enrichment. (B) Mean term specificity of the top 10 enriched GO terms for each cell type at different minimum enhancer length thresholds. Note that specificity increases with enhancer length. (C) Term specificity of the top 10 enriched GO terms normalized to the mean term specificity of GO terms enriched in shuffled enhancers. For each cell type, we shuffled the genomic coordinates of enhancers 100 times along the same chromosome. For each shuffle, we assigned enhancers to nearby genes and calculated enriched GO terms. We computed the mean information content for each cell type by averaging the information content of the top 10 GO terms for each shuffle and enhancer size. Note that compared with random expectation, the increase of term specificity with enhancer length is even more pronounced (compare with B).
Fig. 4.
Fig. 4.
GWAS SNP enhancer enrichment signal is more pronounced in stretch enhancers. (A) Rheumatoid arthritis GWAS loci are progressively and specifically enriched in GM12878 stretch enhancers. Enrichment and significance is calculated using a permutation test (Materials and Methods). (B) Fasting glucose–related traits GWAS loci are progressively and specifically enriched in islet stretch enhancers. (C) Example of a rheumatoid arthritis GWAS SNP (rs615672) that overlaps a GM12878 stretch enhancer. (D) Example of a fasting glucose–related traits GWAS SNP (rs11071657) and a T2D GWAS SNP (rs7172432) that overlap islet stretch enhancers.
Fig. 5.
Fig. 5.
Functional analysis of stretch enhancers. (A) K-means clustering all enhancers based on activity level (Materials and Methods) reveals 20 different enhancer clusters (y axis) of differing cell type specificity (x axis). Intensity of shading represents activity level. (B) Islet-specific enhancer cluster 17 sequences have significantly different enhancer activity compared with K562-specific enhancer cluster 19 sequences in relevant cell types. Significance is calculated using a Wilcoxon rank sum test. Relative luciferase activity is shown (Materials and Methods) and expressed in arbitrary units (a.u.). (C–F) Intragenic (C and D) and intergenic (E and F) human islet stretch enhancer sequences confer specific lacZ transgene expression in the pancreatic primordium of e11.5 mouse embryos. Whole mount (C and E) and histological analysis (D and F) of transgenic embryos expressing hsp-68 lacZ under the control of stretch enhancer sequences. Arrowhead indicates the specific, reproducible expression pattern observed. Numbers indicate the fraction of embryos exhibiting this pattern. (Scale bars in D and F, 100 μm.) dp, vp, dorsal or ventral pancreatic buds; st, stomach; li, liver; mg, midgut.

References

    1. Zhou VW, Goren A, Bernstein BE. Charting histone modifications and the functional organization of mammalian genomes. Nat Rev Genet. 2011;12(1):7–18. - PubMed
    1. Ernst J, et al. Mapping and analysis of chromatin state dynamics in nine human cell types. Nature. 2011;473(7345):43–49. - PMC - PubMed
    1. Ernst J, Kellis M. Discovery and characterization of chromatin states for systematic annotation of the human genome. Nat Biotechnol. 2010;28(8):817–825. - PMC - PubMed
    1. Ernst J, Kellis M. ChromHMM: Automating chromatin-state discovery and characterization. Nat Methods. 2012;9(3):215–216. - PMC - PubMed
    1. Hoffman MM, et al. Unsupervised pattern discovery in human chromatin structure through genomic segmentation. Nat Methods. 2012;9(5):473–476. - PMC - PubMed

Publication types

MeSH terms

Associated data