

TNFα-dependent development of lymphoid tissue in the absence of RORγt⁺ lymphoid tissue inducer cells
- PMID: 24129162
- PMCID: PMC4264842
- DOI: 10.1038/mi.2013.79
TNFα-dependent development of lymphoid tissue in the absence of RORγt⁺ lymphoid tissue inducer cells
Abstract
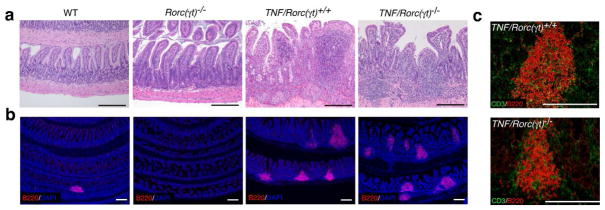
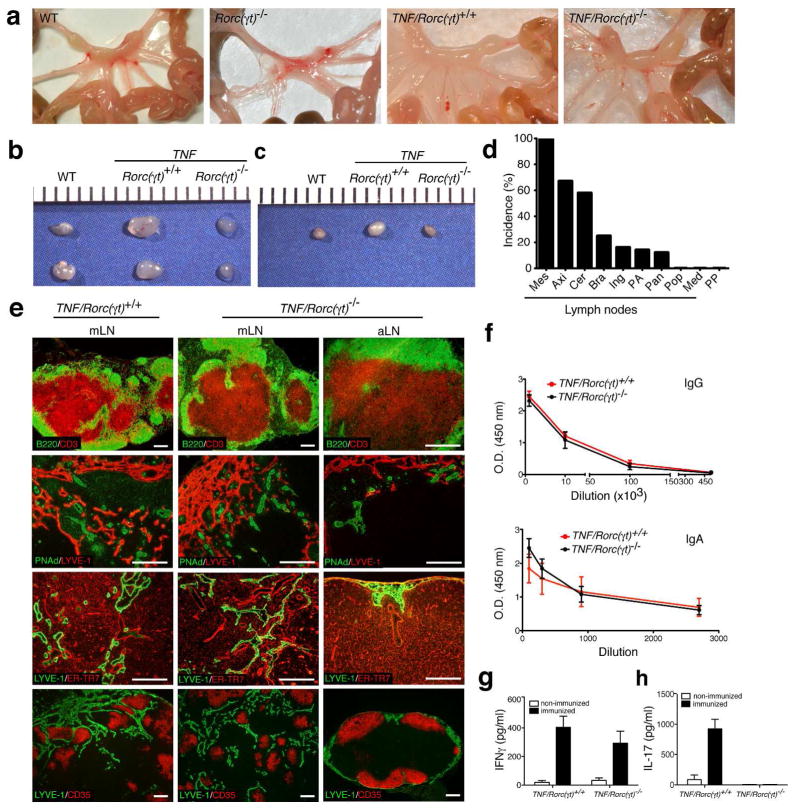
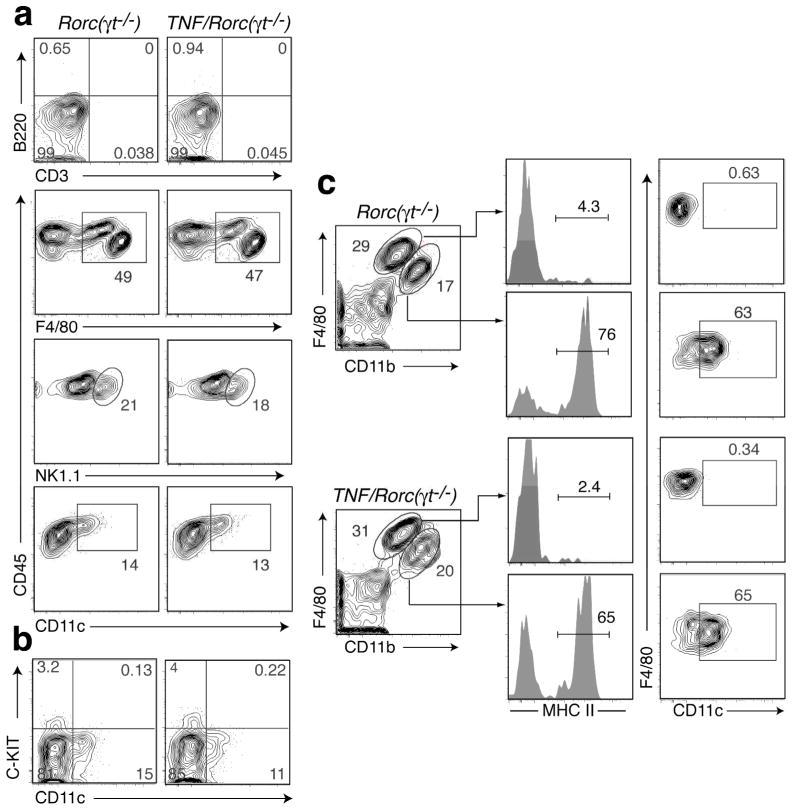
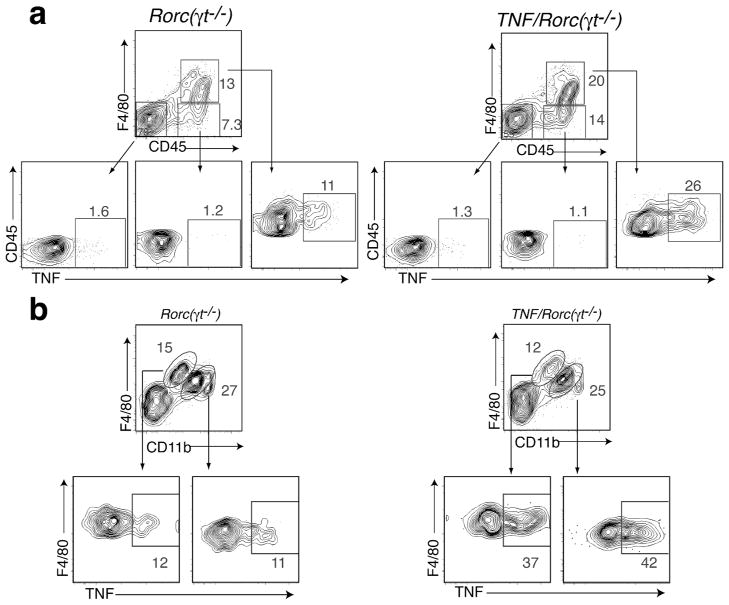
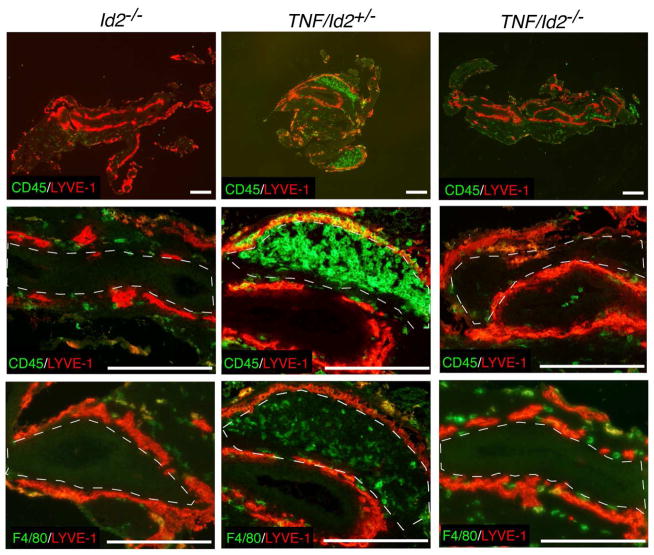
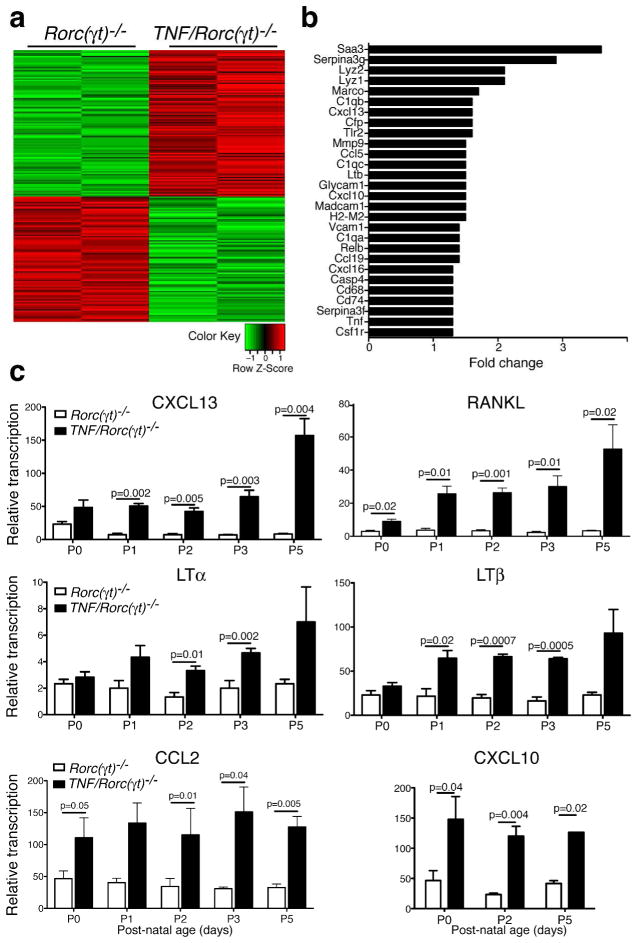
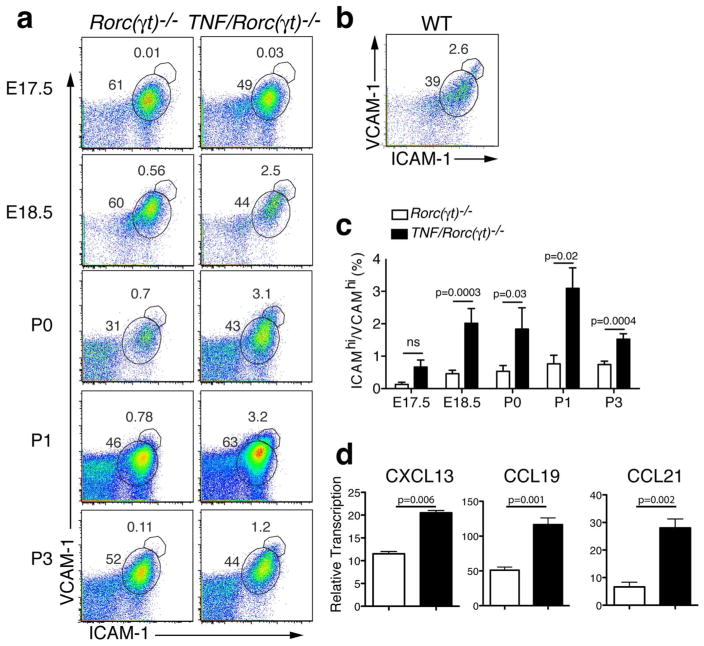
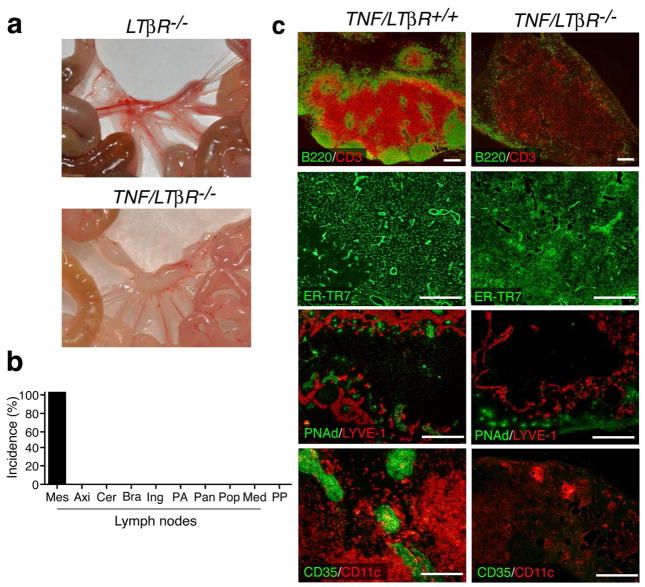
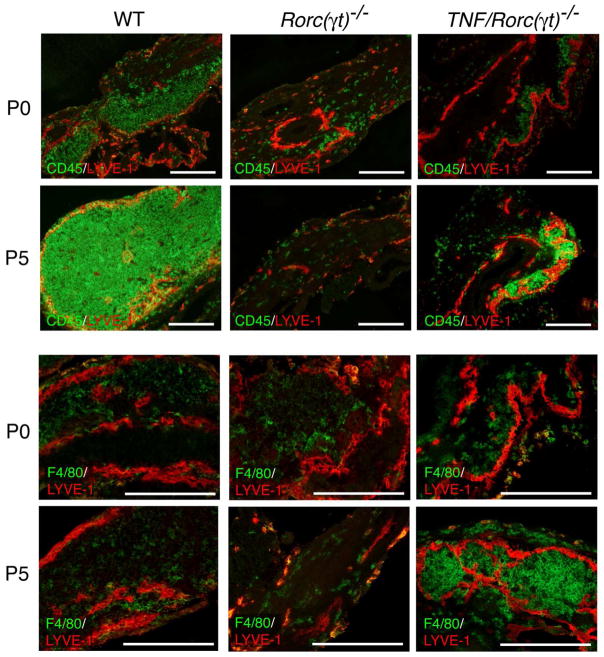
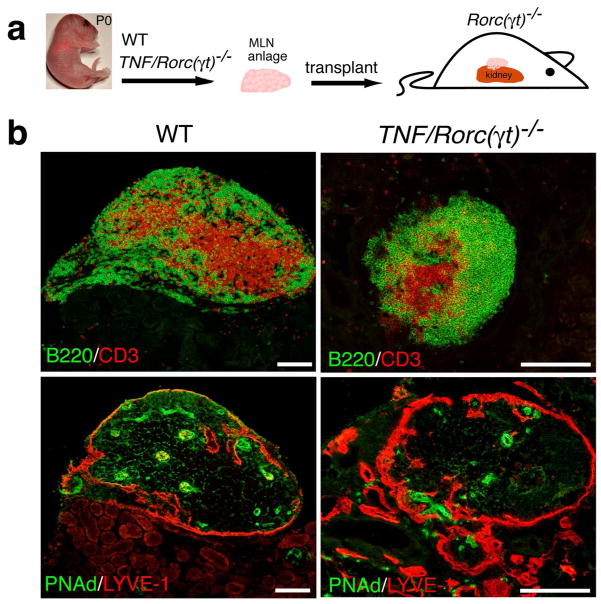
Lymphoid tissue often forms within sites of chronic inflammation. Here we report that expression of the proinflammatory cytokine tumor necrosis factor α (TNFα) drives development of lymphoid tissue in the intestine. Formation of this ectopic lymphoid tissue was not dependent on the presence of canonical RORgt(+) lymphoid tissue-inducer (LTi) cells, because animals expressing increased levels of TNFα but lacking RORgt(+) LTi cells (TNF/Rorc(gt)(-/-) mice) developed lymphoid tissue in inflamed areas. Unexpectedly, such animals developed several lymph nodes (LNs) that were structurally and functionally similar to those of wild-type animals. TNFα production by F4/80(+) myeloid cells present within the anlagen was important for the activation of stromal cells during the late stages of embryogenesis and for the activation of an organogenic program that allowed the development of LNs. Our results show that lymphoid tissue organogenesis can occur in the absence of LTi cells and suggest that interactions between TNFα-expressing myeloid cells and stromal cells have an important role in secondary lymphoid organ formation.
Conflict of interest statement
The authors declare no financial interests
Figures
Similar articles
-
Runx1/Cbfβ2 complexes are required for lymphoid tissue inducer cell differentiation at two developmental stages.J Immunol. 2011 Feb 1;186(3):1450-7. doi: 10.4049/jimmunol.1000162. Epub 2010 Dec 22. J Immunol. 2011. PMID: 21178013
-
Regulated expression of nuclear receptor RORγt confers distinct functional fates to NK cell receptor-expressing RORγt(+) innate lymphocytes.Immunity. 2010 Nov 24;33(5):736-51. doi: 10.1016/j.immuni.2010.10.017. Immunity. 2010. PMID: 21093318 Free PMC article.
-
T-helper 17 and interleukin-17-producing lymphoid tissue inducer-like cells make different contributions to colitis in mice.Gastroenterology. 2012 Nov;143(5):1288-1297. doi: 10.1053/j.gastro.2012.07.108. Epub 2012 Jul 28. Gastroenterology. 2012. PMID: 22850180
-
Lymphoid tissue inducer-A divergent member of the ILC family.Cytokine Growth Factor Rev. 2018 Aug;42:5-12. doi: 10.1016/j.cytogfr.2018.02.004. Epub 2018 Feb 13. Cytokine Growth Factor Rev. 2018. PMID: 29454785 Free PMC article. Review.
-
Involvement of lymphoid inducer cells in the development of secondary and tertiary lymphoid structure.BMB Rep. 2009 Apr 30;42(4):189-93. doi: 10.5483/bmbrep.2009.42.4.189. BMB Rep. 2009. PMID: 19403040 Review.
Cited by
-
Tertiary lymphoid structures and B lymphocytes in cancer prognosis and response to immunotherapies.Oncoimmunology. 2021 Mar 29;10(1):1900508. doi: 10.1080/2162402X.2021.1900508. Oncoimmunology. 2021. PMID: 33854820 Free PMC article. Review.
-
Lymph node stromal cells: cartographers of the immune system.Nat Immunol. 2020 Apr;21(4):369-380. doi: 10.1038/s41590-020-0635-3. Epub 2020 Mar 23. Nat Immunol. 2020. PMID: 32205888 Review.
-
Overview of the development, characterization, and function of human types 1, 2, and 3 innate lymphoid cells.Einstein (Sao Paulo). 2024 Nov 29;22:eRW1042. doi: 10.31744/einstein_journal/2024RW1042. eCollection 2024. Einstein (Sao Paulo). 2024. PMID: 39630753 Free PMC article. Review.
-
Oxysterols in intestinal immunity and inflammation.J Intern Med. 2019 Apr;285(4):367-380. doi: 10.1111/joim.12855. Epub 2018 Nov 26. J Intern Med. 2019. PMID: 30478861 Free PMC article. Review.
-
Maturation of Tertiary Lymphoid Structures.Methods Mol Biol. 2025;2864:43-55. doi: 10.1007/978-1-0716-4184-2_3. Methods Mol Biol. 2025. PMID: 39527216 Review.
References
-
- Sun Z, Unutmaz D, Zou YR, Sunshine MJ, Pierani A, Brenner-Morton S, et al. Requirement for RORgamma in thymocyte survival and lymphoid organ development. Science. 2000;288(5475):2369–2373. - PubMed
-
- Eberl G, Marmon S, Sunshine MJ, Rennert PD, Choi Y, Littman DR. An essential function for the nuclear receptor RORgamma(t) in the generation of fetal lymphoid tissue inducer cells. Nat Immunol. 2004;5(1):64–73. - PubMed
Publication types
MeSH terms
Substances
Grants and funding
LinkOut - more resources
Full Text Sources
Other Literature Sources
Molecular Biology Databases
Miscellaneous
