

Parameters Affecting Image-guided, Hydrodynamic Gene Delivery to Swine Liver
- PMID: 24129227
- PMCID: PMC4027427
- DOI: 10.1038/mtna.2013.52
Parameters Affecting Image-guided, Hydrodynamic Gene Delivery to Swine Liver
Abstract
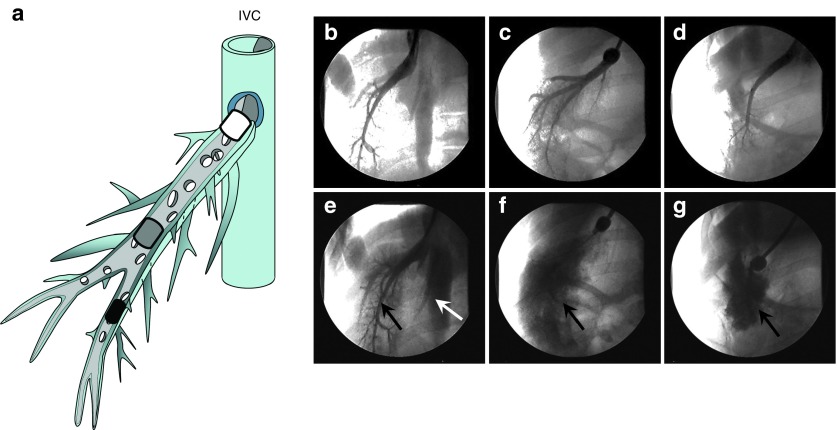
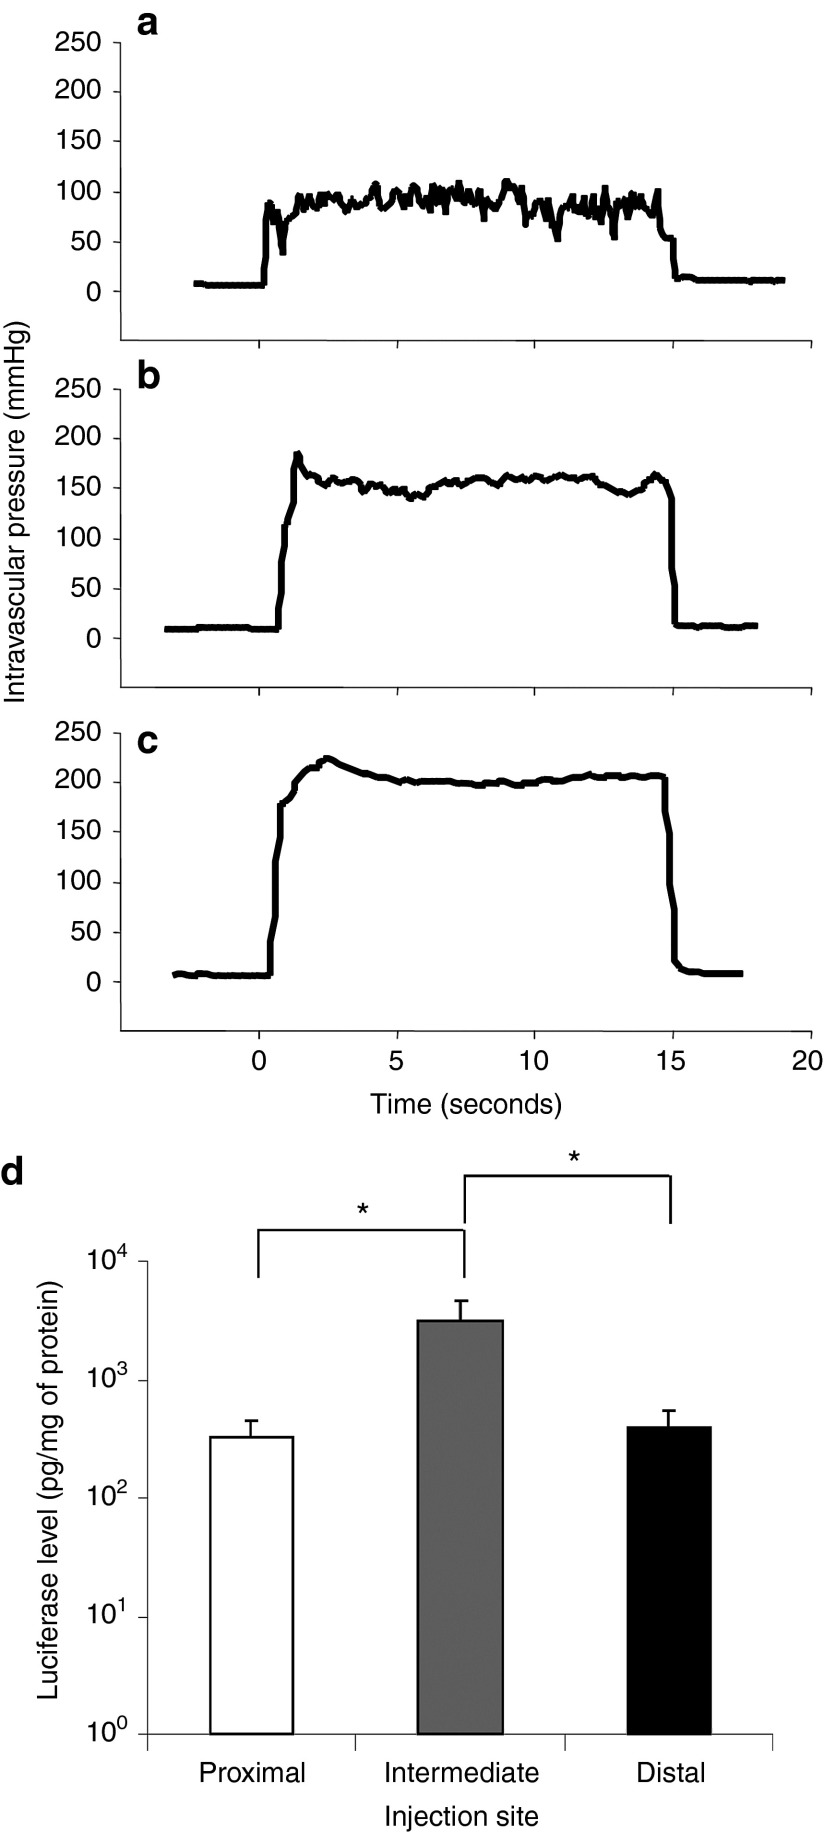
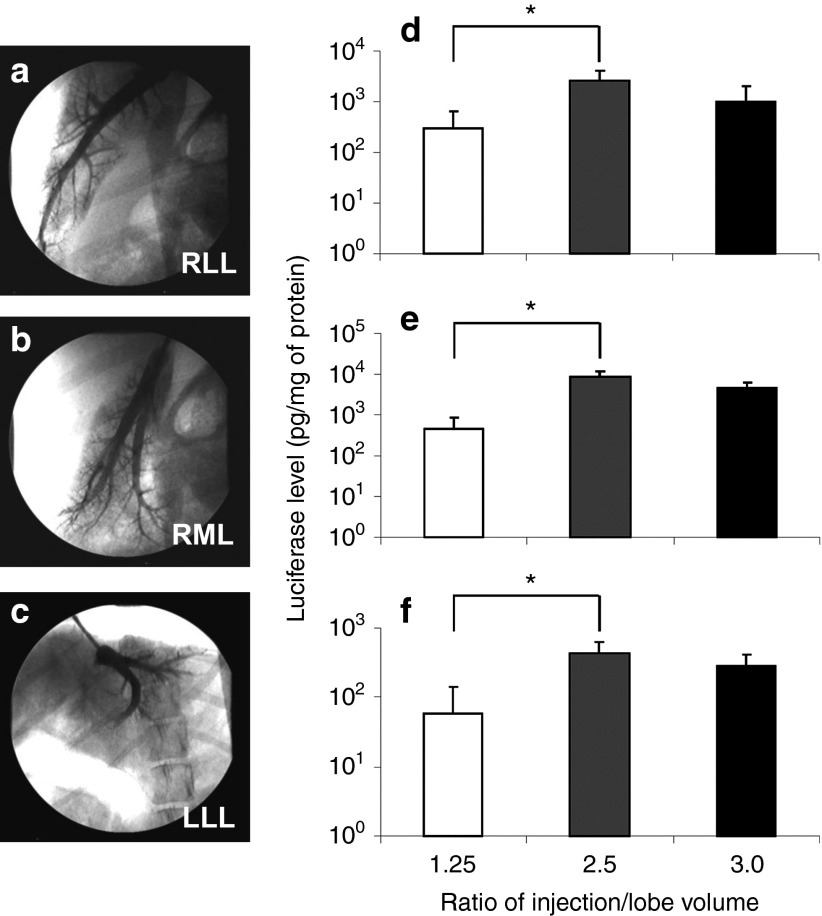
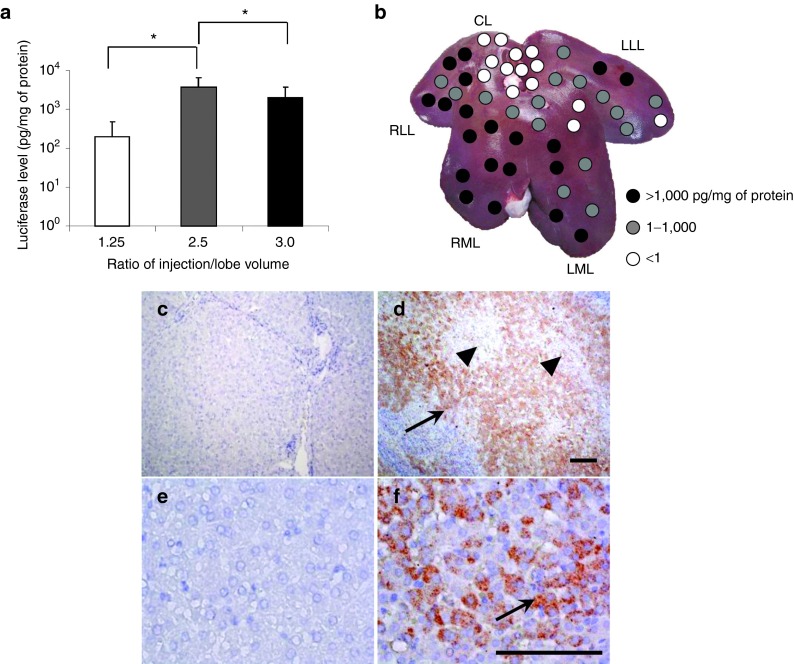
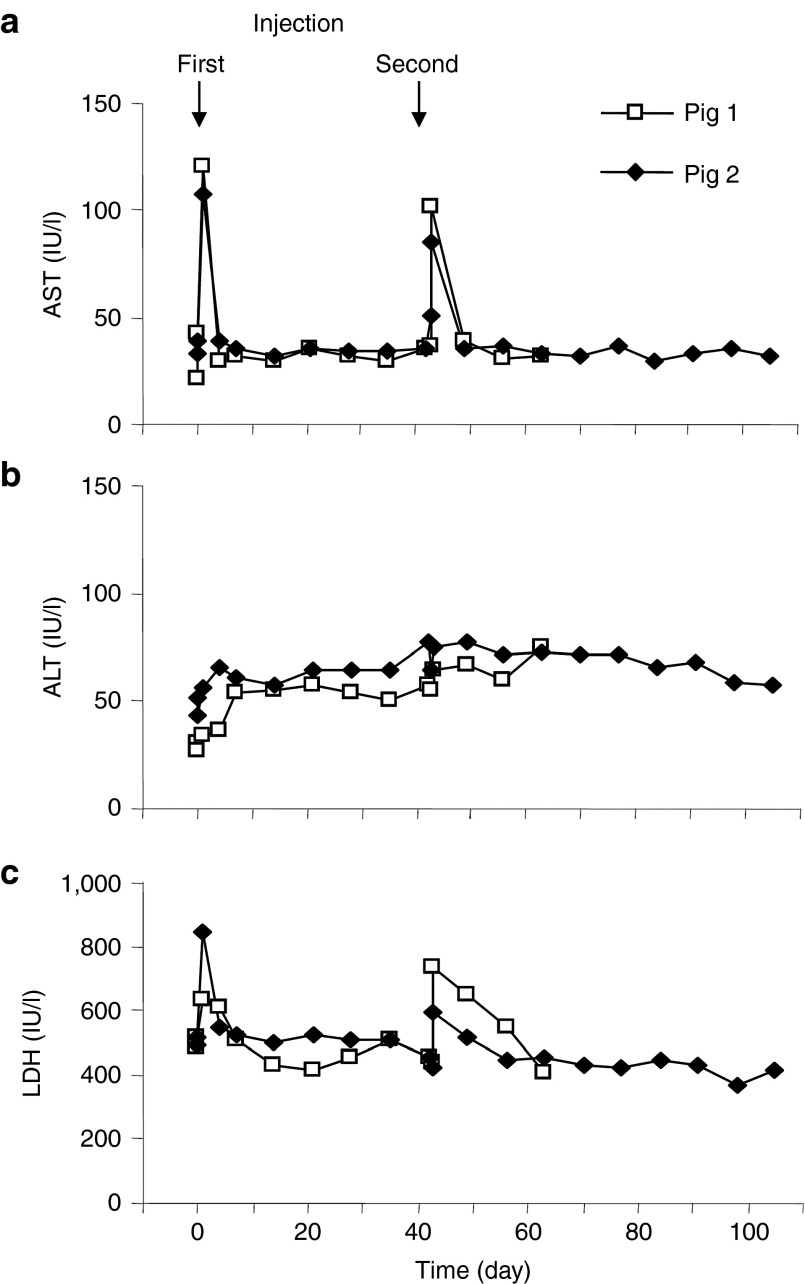
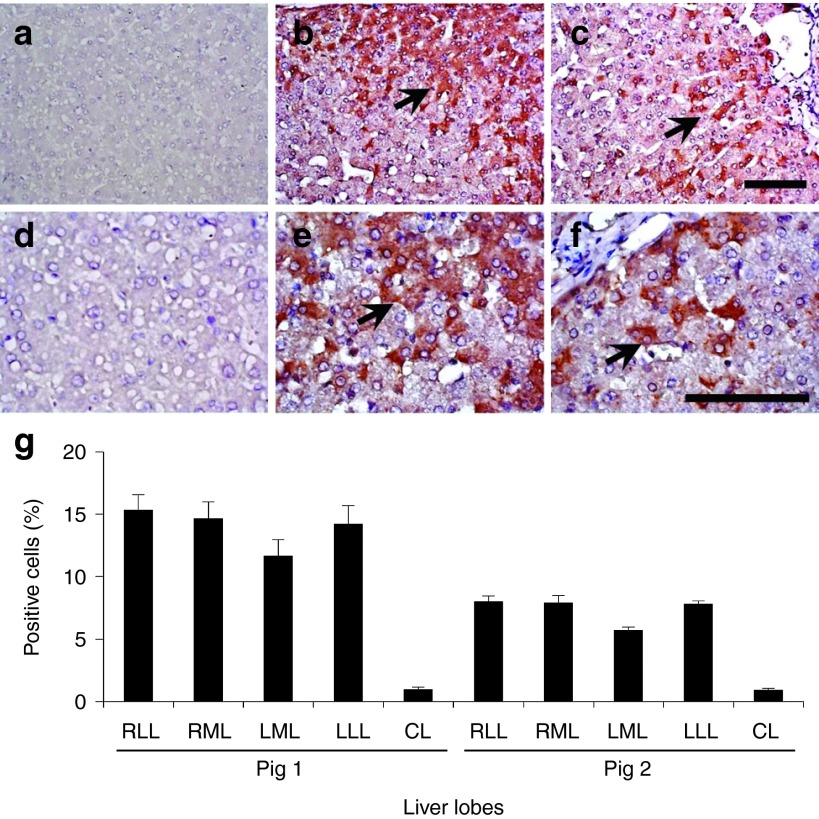
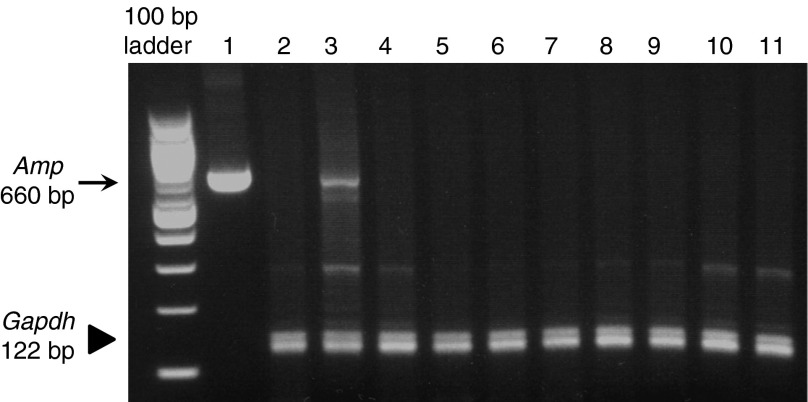
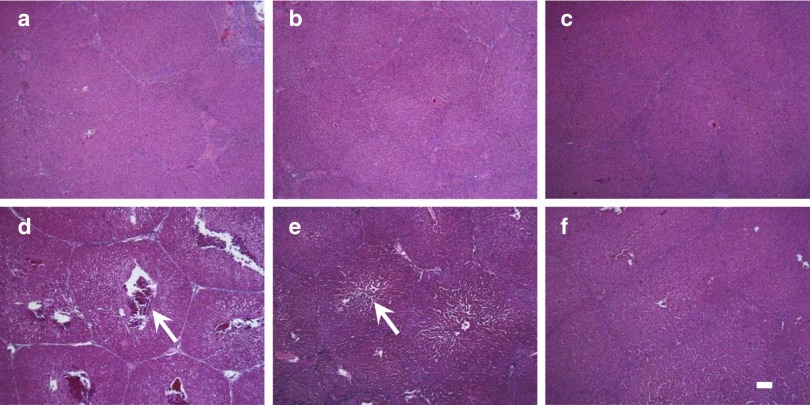
Development of a safe and effective method for gene delivery to hepatocytes is a critical step toward gene therapy for liver diseases. Here, we assessed the parameters for gene delivery to the livers of large animals (pigs, 40-65 kg) using an image-guided hydrodynamics-based procedure that involves image-guided catheter insertion into the lobular hepatic vein and hydrodynamic injection of reporter plasmids using a computer-controlled injector. We demonstrated that injection parameters (relative position of the catheter in the hepatic vasculature, intravascular pressure upon injection, and injection volume) are directly related to the safety and efficiency of the procedure. By optimizing these parameters, we explored for the first time, the advantage of the procedure for sequential injections to multiple lobes in human-sized pigs. The optimized procedure resulted in sustained expression of the human α-1 antitrypsin gene in livers for more than 2 months after gene delivery. In addition, repeated hydrodynamic gene delivery was safely conducted and no adverse events were seen in the entire period of the study. Our results support the clinical applicability of the image-guided hydrodynamic gene delivery method for the treatment of liver diseases.Molecular Therapy-Nucleic Acids (2013) 2, e128; doi:10.1038/mtna.2013.52; published online 15 October 2013.
Figures
Similar articles
-
Liver lobe-specific hydrodynamic gene delivery to baboons: A preclinical trial for hemophilia gene therapy.Mol Ther Nucleic Acids. 2023 May 17;32:903-913. doi: 10.1016/j.omtn.2023.05.018. eCollection 2023 Jun 13. Mol Ther Nucleic Acids. 2023. PMID: 37346981 Free PMC article.
-
Image-guided, lobe-specific hydrodynamic gene delivery to swine liver.Mol Ther. 2009 Mar;17(3):491-9. doi: 10.1038/mt.2008.294. Epub 2009 Jan 20. Mol Ther. 2009. PMID: 19156134 Free PMC article.
-
Image-guided, intravascular hydrodynamic gene delivery to skeletal muscle in pigs.Mol Ther. 2010 Jan;18(1):93-100. doi: 10.1038/mt.2009.206. Epub 2009 Sep 8. Mol Ther. 2010. PMID: 19738603 Free PMC article.
-
Hydrodynamic delivery of DNA.Expert Opin Biol Ther. 2003 Sep;3(6):911-8. doi: 10.1517/14712598.3.6.911. Expert Opin Biol Ther. 2003. PMID: 12943450 Review.
-
The mechanism of naked DNA uptake and expression.Adv Genet. 2005;54:3-20. doi: 10.1016/S0065-2660(05)54001-X. Adv Genet. 2005. PMID: 16096005 Review.
Cited by
-
Effects of Fibrotic Tissue on Liver-targeted Hydrodynamic Gene Delivery.Mol Ther Nucleic Acids. 2016 Aug 30;5(8):e359. doi: 10.1038/mtna.2016.63. Mol Ther Nucleic Acids. 2016. PMID: 27574785 Free PMC article.
-
Successful liver-directed gene delivery by ERCP-guided hydrodynamic injection (with videos).Gastrointest Endosc. 2018 Oct;88(4):755-763.e5. doi: 10.1016/j.gie.2018.06.022. Epub 2018 Jul 3. Gastrointest Endosc. 2018. PMID: 30220303 Free PMC article.
-
Safety assessment of liver-targeted hydrodynamic gene delivery in dogs.PLoS One. 2014 Sep 24;9(9):e107203. doi: 10.1371/journal.pone.0107203. eCollection 2014. PLoS One. 2014. PMID: 25251246 Free PMC article.
-
Liver-targeted hydrodynamic gene therapy: Recent advances in the technique.World J Gastroenterol. 2016 Oct 28;22(40):8862-8868. doi: 10.3748/wjg.v22.i40.8862. World J Gastroenterol. 2016. PMID: 27833377 Free PMC article. Review.
-
Liver lobe-specific hydrodynamic gene delivery to baboons: A preclinical trial for hemophilia gene therapy.Mol Ther Nucleic Acids. 2023 May 17;32:903-913. doi: 10.1016/j.omtn.2023.05.018. eCollection 2023 Jun 13. Mol Ther Nucleic Acids. 2023. PMID: 37346981 Free PMC article.
References
-
- Liu F, Song Y, Liu D. Hydrodynamics-based transfection in animals by systemic administration of plasmid DNA. Gene Ther. 1999;6:1258–1266. - PubMed
-
- Zhang G, Budker V, Wolff JA. High levels of foreign gene expression in hepatocytes after tail vein injections of naked plasmid DNA. Hum Gene Ther. 1999;10:1735–1737. - PubMed
-
- Suda T, Liu D. Hydrodynamic gene delivery: its principles and applications. Mol Ther. 2007;15:2063–2069. - PubMed
Grants and funding
LinkOut - more resources
Full Text Sources
Other Literature Sources
