. 2013 Oct 29;109(9):2412-23.
doi: 10.1038/bjc.2013.557. Epub 2013 Oct 15.

CXCR3/CCR5 pathways in metastatic melanoma patients treated with adoptive therapy and interleukin-2

Affiliations

CXCR3/CCR5 pathways in metastatic melanoma patients treated with adoptive therapy and interleukin-2

D Bedognetti et al. Br J Cancer. .

Abstract

Background: Adoptive therapy with tumour-infiltrating lymphocytes (TILs) induces durable complete responses (CR) in ∼20% of patients with metastatic melanoma. The recruitment of T cells through CXCR3/CCR5 chemokine ligands is critical for immune-mediated rejection. We postulated that polymorphisms and/or expression of CXCR3/CCR5 in TILs and the expression of their ligands in tumour influence the migration of TILs to tumours and tumour regression.

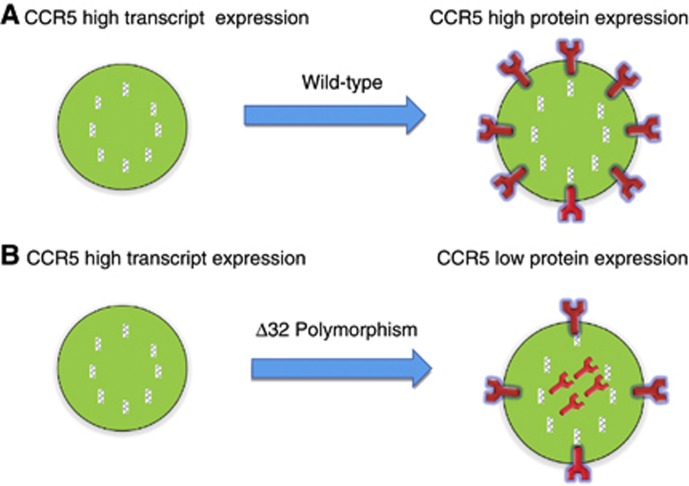
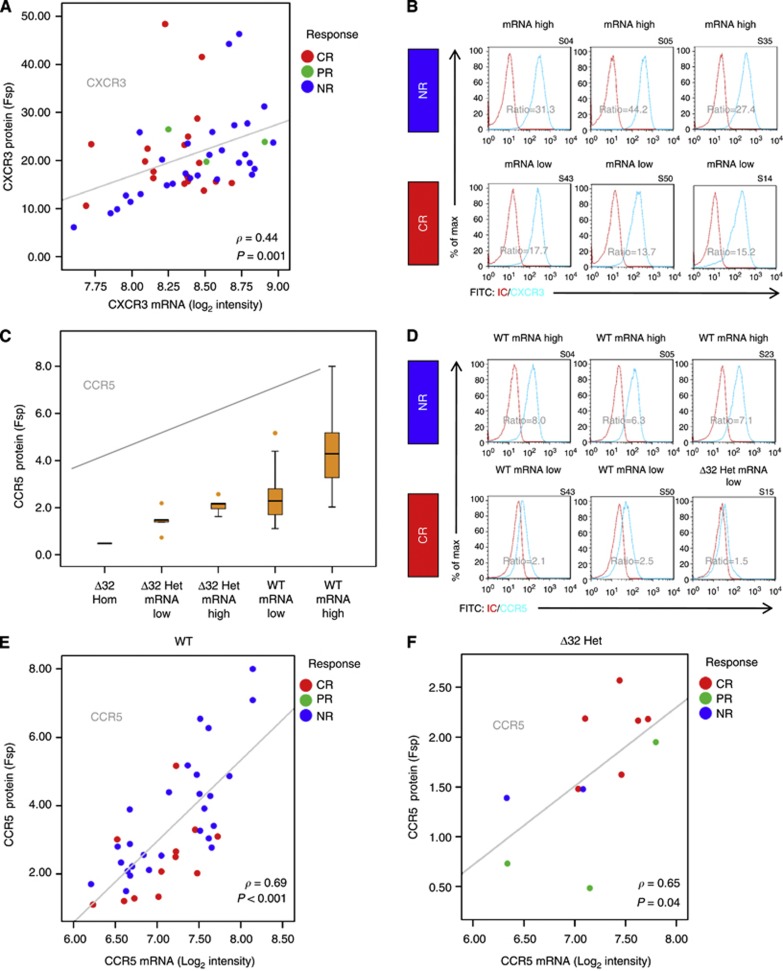
Methods: Tumour-infiltrating lymphocytes from 142 metastatic melanoma patients enrolled in adoptive therapy trials were genotyped for CXCR3 rs2280964 and CCR5-Δ32 deletion, which encodes a protein not expressed on the cell surface. Expression of CXCR3/CCR5 in TILs and CXCR3/CCR5 and ligand genes in 113 available parental tumours was also assessed. Tumour-infiltrating lymphocyte data were validated by flow cytometry (N=50).

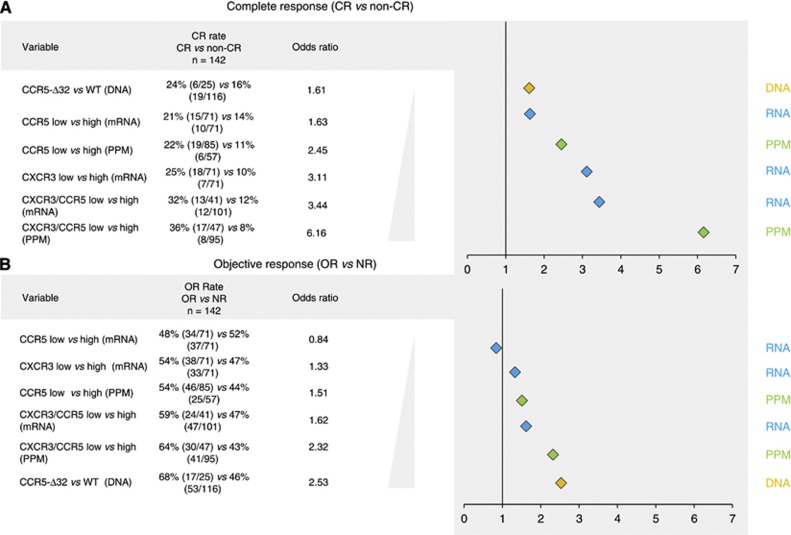
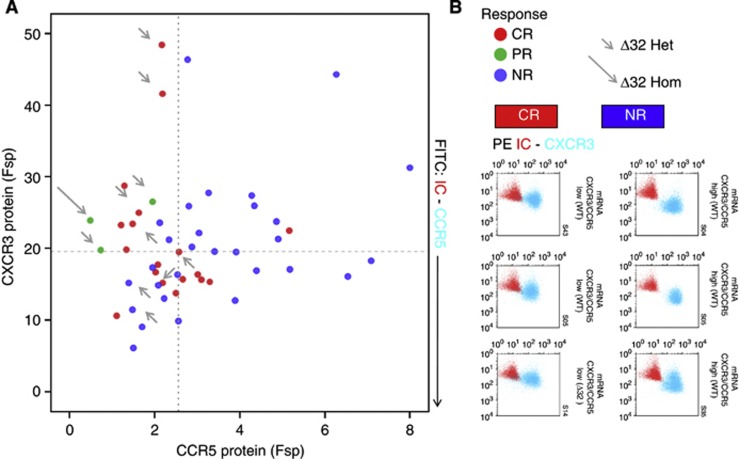
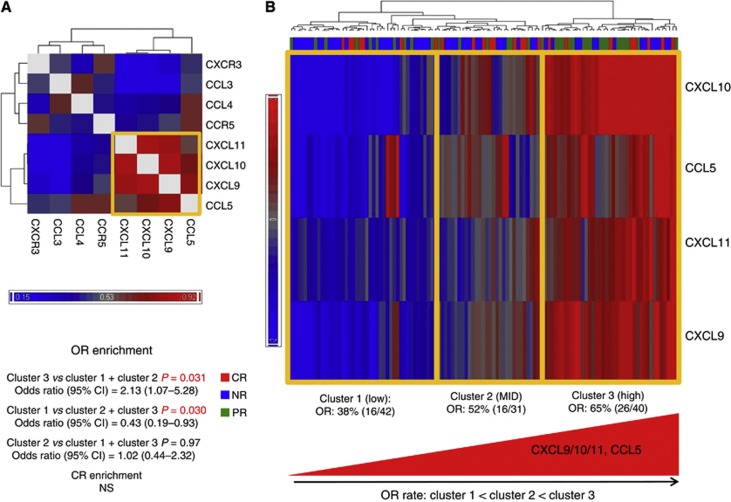
Results: The full gene expression/polymorphism model, which includes CXCR3 and CCR5 expression data, CCR5-Δ32 polymorphism data and their interaction, was significantly associated with both CR and overall response (OR; P=0.0009, and P=0.007, respectively). More in detail, the predicted underexpression of both CXCR3 and CCR5 according to gene expression and polymorphism data (protein prediction model, PPM) was associated with response to therapy (odds ratio=6.16 and 2.32, for CR and OR, respectively). Flow cytometric analysis confirmed the PPM. Coordinate upregulation of CXCL9, CXCL10, CXCL11, and CCL5 in pretreatment tumour biopsies was associated with OR.

Conclusion: Coordinate overexpression of CXCL9, CXCL10, CXCL11, and CCL5 in pretreatment tumours was associated with responsiveness to treatment. Conversely, CCR5-Δ32 polymorphism and CXCR3/CCR5 underexpression influence downregulation of the corresponding receptors in TILs and were associated with likelihood and degree of response.


Figures

Figure 1
Figure 1
Effect of CXCR3/CCR5 expression status of tumor-infiltrating lymphocytes (TILs) on complete response (A) and objective response (B). Odds ratios are represented. CCR5-Δ32 (DNA): presence of Δ32 polymorphism; CCR5-Δ32 low (PPM): CCR5 low according to the PPM (CCR5 below the median value according to the gene expression data or presence of CCR5-Δ32 polymorphism); CCR5 low (mRNA): CCR5 below the median value according to the gene expression data; CXCR3 low (RNA): CXCR3 below the median value according to the gene expression data; CXCR3/CCR5 low (mRNA): CXCR3 and CCR5 below the median value according to the gene expression data; CXCR3/CCR5 low (PPM): CXCR3 and CCR5 below the median value according to the gene expression data or CXCR3 low and CCR5 high in presence of CCR5-Δ32 polymorphism. P-values are from χ2-test. Abbreviations: CI=confidence interval; CR=complete response; non-CR=PR+NR; OR=objective response (CR+PR); PPM=protein prediction model; PR=partial response; WT=wild-type.
Figure 2
Figure 2
Protein prediction model. In wild-type subjects (A) we assume that high levels of CCR5 transcript are associated with high expression of CCR5 on cell surface. However, because Δ32 polymorphism encodes a protein not expressed on the cell surface (B), CCR5-Δ32 carriers were expected to have a low receptor expression (decreased in heterozygous individuals and absent in homozygous individuals) despite the high transcript expression.
Figure 3
Figure 3
Correlation between CXCR3/CCR5 transcript and protein expression in tumour-infiltrating lymphocytes (TILs). (A) Scatter plot representing the Spearman correlations between CXCR3 transcript (Log2 intensity, x axis) and protein expression (Fsp, y axis). (B) Overlaid histograms representing three representative CR samples with low level of CXCR3 transcript and receptor expression, and three NR samples with high level of CXCR3 transcript and receptor expression (according to the median value). Each sample is stained with CXCR3-PE (light blue graph) or with the corresponding IC (red graph). (C) Box plots showing the comparisons between samples with different CCR5 expression values (low and high according to the median value based on gene expression) and CCR5-Δ32 status (x axes): (D) Overlaid histograms exhibiting three representative CR samples with low level of CCR5 transcript and receptor expression and three NR samples with high level of CCR5 receptor expression (according to the median value). CR panel includes two CCR5 wild-type samples and one CCR5-Δ32 heterozygous sample. NR panel includes three CCR5 wild-type samples. Each sample is stained with CCR5-FITC (light blue graph) or with the corresponding IC (red graph). (E, F) Scatter plots representing the Spearman correlations between CCR5 transcript (Log2 intensity, x axis) and protein expression (Fsp, y axis) within all the samples (E) or within the CCR5-Δ32 heterozygous samples (F). Box plots: the top and the bottom edge of the tinted boxes show the values of the upper and lower quartiles, respectively. The top and the end of the whiskers represent the maximum and the minimum values excluding the outliers (which are plotted as individual dots). The horizontal lines indicate the median value. Specific fluorescent signal (Fsp) was calculated on live cells (7AAD negative) by normalising to the respective isotype control. Abbreviations: Δ32 Het mRNA low=CCR5-Δ32 heterozygous and CCR5 mRNA low; Δ32 Het mRNA high=CCR5-Δ32 heterozygous and CCR5 mRNA high; Δ32 Hom=CCR5-Δ32 homozygous; CR=complete response; PR=partial response; WT mRNA low=CCR5 wild-type and CCR5 mRNA low; WT mRNA high=CCR5 wild-type and CCR5 mRNA low; y axis represents CCR5-specific fluorescence signal (Fsp). P-values are from the Spearman rank correlation coefficient (ρ) test.
Figure 4
Figure 4
Flow cytometry analysis of CXCR3 and CCR5 receptor expression by tumour-infiltrating lymphocytes (TILs). (A) Scatter plot of CXCR3 and CCR5 protein expression on cells surface. x axis: CCR5-specific fluorescent signal (Fsp); y axis: CXCR3-specific fluorescent signal (Fsp). Vertical and horizontal dotted lines represent the median values of the x and y axes, respectively. CR samples are represented with red dots, PR samples with green dots and NR samples with blue dots. The short grey arrows indicate CCR5-Δ32 heterozygous sample and the long grey arrow indicates the CCR5-Δ32 homozygous sample. (B) Flow cytometry scatter plots of three representative CR samples with low levels of CXCR3 and CCR5 transcript and receptor expression and three NR samples with high level of CXCR3 and CCR5 transcript and receptor expression (according to the median value) are represented. CR panel includes two CCR5 wild-type samples and one CCR5-Δ32 heterozygous sample. NR panel includes three CCR5 wild-type samples. Each sample was stained with CXCR3-PE and CCR5-FITC (light blue dots) or with the corresponding IC (red dots). CXCR3 and CCR5 gene expression status and CCR5 polymorphism is indicated for each sample. Specific fluorescent signal was calculated on live cells (7AAD negative) by normalising to the respective IC. Abbreviations: CR=complete response; IC=isotype control; OR=objective response (CR+PR); PR=partial response.
Figure 5
Figure 5
CXCR3/CCR5 ligands gene expression in pretreatment biopsies. (A) Hierarchical clustering of gene–gene correlation from 113 pretreatment tumours. The Spearman rank correlation coefficient (ρ) was calculated between combination of CXCR3, CCR5, CXCR3 ligands (CXCL9, CXCL10, and CXCL11) and CCR5 ligands (CCL3, CCL4, and CCL5). CXCL9, CXCL10, CXCL11 and CCL5 clustered together and were selected for hierarchical clustering analysis based on the mean-centered gene expression values (B). Patients with clinical complete responses (CR) are shown in red, patients with partial remission (PR) are shown in green and non-responders (NR) are shown in blue. Abbreviations: non-CR=PR+NR; OR=objective response (CR+PR). P-values are from the χ2-test.

Similar articles

Cited by

References

    1. Ascierto ML, De Giorgi V, Liu QZ, Bedognetti D, Spivey TL, Murtas D, Uccellini L, Ayotte BD, Stroncek DF, Chouchane L, Manjili MH, Wang E, Marincola FM. An immunologic portrait of cancer. J Transl Med. 2011;9:146. - PMC - PubMed
    1. Ascierto ML, Kmieciak M, Idowu MO, Manjili R, Zhao Y, Grimes M, Dumur C, Wang E, Ramakrishnan V, Wang XY, Bear HD, Marincola FM, Manjili MH. A signature of immune function genes associated with recurrence-free survival in breast cancer patients. Breast Cancer Res Treat. 2012;131 (3:871–880. - PMC - PubMed
    1. Bedognetti D, Balwit JM, Wang E, Disis ML, Britten CM, Delogu LG, Tomei S, Fox BA, Gajewski TF, Marincola FM, Butterfield LH. SITC/iSBTc cancer immunotherapy biomarkers resource document: online resources and useful tools—a compass in the land of biomarker discovery. J Transl Med. 2011;9:155. - PMC - PubMed
    1. Bedognetti D, Wang E, Sertoli MR, Marincola FM. Gene-expression profiling in vaccine therapy and immunotherapy for cancer. Expert Rev Vaccines. 2010;9 (6:555–565. - PMC - PubMed
    1. Carrington M, Dean M, Martin MP, O′Brien SJ. Genetics of HIV-1 infection: chemokine receptor CCR5 polymorphism and its consequences. Hum Mol Genet. 1999;8 (10:1939–1945. - PubMed

Publication types

MeSH terms