SILAC-based phosphoproteomics reveals an inhibitory role of KSR1 in p53 transcriptional activity via modulation of DBC1
- PMID: 24129246
- PMCID: PMC3833216
- DOI: 10.1038/bjc.2013.628
SILAC-based phosphoproteomics reveals an inhibitory role of KSR1 in p53 transcriptional activity via modulation of DBC1
Abstract
Background: We have previously identified kinase suppressor of ras-1 (KSR1) as a potential regulatory gene in breast cancer. KSR1, originally described as a novel protein kinase, has a role in activation of mitogen-activated protein kinases. Emerging evidence has shown that KSR1 may have dual functions as an active kinase as well as a scaffold facilitating multiprotein complex assembly. Although efforts have been made to study the role of KSR1 in certain tumour types, its involvement in breast cancer remains unknown.
Methods: A quantitative mass spectrometry analysis using stable isotope labelling of amino acids in cell culture (SILAC) was implemented to identify KSR1-regulated phosphoproteins in breast cancer. In vitro luciferase assays, co-immunoprecipitation as well as western blotting experiments were performed to further study the function of KSR1 in breast cancer.
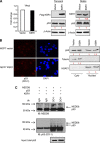
Results: Of significance, proteomic analysis reveals that KSR1 overexpression decreases deleted in breast cancer-1 (DBC1) phosphorylation. Furthermore, we show that KSR1 decreases the transcriptional activity of p53 by reducing the phosphorylation of DBC1, which leads to a reduced interaction of DBC1 with sirtuin-1 (SIRT1); this in turn enables SIRT1 to deacetylate p53.
Conclusion: Our findings integrate KSR1 into a network involving DBC1 and SIRT1, which results in the regulation of p53 acetylation and its transcriptional activity.
Figures


Similar articles
-
Proteomic profile of KSR1-regulated signalling in response to genotoxic agents in breast cancer.Breast Cancer Res Treat. 2015 Jun;151(3):555-68. doi: 10.1007/s10549-015-3443-y. Epub 2015 May 29. Breast Cancer Res Treat. 2015. PMID: 26022350 Free PMC article.
-
Negative regulation of the deacetylase SIRT1 by DBC1.Nature. 2008 Jan 31;451(7178):587-90. doi: 10.1038/nature06515. Nature. 2008. PMID: 18235502 Free PMC article.
-
Balance between SIRT1 and DBC1 expression is lost in breast cancer.Cancer Sci. 2010 Jul;101(7):1738-44. doi: 10.1111/j.1349-7006.2010.01573.x. Epub 2010 Mar 24. Cancer Sci. 2010. PMID: 20412117 Free PMC article.
-
Inflammatory bowel disease reveals the kinase activity of KSR1.J Clin Invest. 2004 Nov;114(9):1233-7. doi: 10.1172/JCI23441. J Clin Invest. 2004. PMID: 15520853 Free PMC article. Review.
-
Use of stable isotope labeling by amino acids in cell culture (SILAC) for phosphotyrosine protein identification and quantitation.Methods Mol Biol. 2009;527:79-92, xi. doi: 10.1007/978-1-60327-834-8_7. Methods Mol Biol. 2009. PMID: 19241007 Free PMC article. Review.
Cited by
-
The scaffold protein KSR1, a novel therapeutic target for the treatment of Merlin-deficient tumors.Oncogene. 2016 Jun 30;35(26):3443-53. doi: 10.1038/onc.2015.404. Epub 2015 Nov 9. Oncogene. 2016. PMID: 26549023 Free PMC article.
-
Chk2 and REGγ-dependent DBC1 regulation in DNA damage induced apoptosis.Nucleic Acids Res. 2014 Dec 1;42(21):13150-60. doi: 10.1093/nar/gku1065. Epub 2014 Oct 31. Nucleic Acids Res. 2014. PMID: 25361978 Free PMC article.
-
KSR1 regulates BRCA1 degradation and inhibits breast cancer growth.Oncogene. 2015 Apr 16;34(16):2103-14. doi: 10.1038/onc.2014.129. Epub 2014 Jun 9. Oncogene. 2015. PMID: 24909178
-
Proteomic profile of KSR1-regulated signalling in response to genotoxic agents in breast cancer.Breast Cancer Res Treat. 2015 Jun;151(3):555-68. doi: 10.1007/s10549-015-3443-y. Epub 2015 May 29. Breast Cancer Res Treat. 2015. PMID: 26022350 Free PMC article.
-
The structure-function relationship of oncogenic LMTK3.Sci Adv. 2020 Nov 13;6(46):eabc3099. doi: 10.1126/sciadv.abc3099. Print 2020 Nov. Sci Adv. 2020. PMID: 33188023 Free PMC article.
References
-
- Adjei AA. Blocking oncogenic Ras signaling for cancer therapy. J Natl Cancer Inst. 2001;93:1062–1074. - PubMed
-
- Brooks CL, Gu W. Ubiquitination, phosphorylation and acetylation: the molecular basis for p53 regulation. Curr Opin Cell Biol. 2003;15:164–171. - PubMed
-
- Cox J, Mann M. MaxQuant enables high peptide identification rates, individualized p.p.b.-range mass accuracies and proteome-wide protein quantification. Nat Biotechnol. 2008;26:1367–1372. - PubMed
Publication types
MeSH terms
Substances
Grants and funding
LinkOut - more resources
Full Text Sources
Other Literature Sources
Medical
Molecular Biology Databases
Research Materials
Miscellaneous

