. 2013 Oct 15;4(5):e00443-13.
doi: 10.1128/mBio.00443-13.

The general phosphotransferase system proteins localize to sites of strong negative curvature in bacterial cells

Affiliations

The general phosphotransferase system proteins localize to sites of strong negative curvature in bacterial cells

Sutharsan Govindarajan et al. mBio. .

Abstract

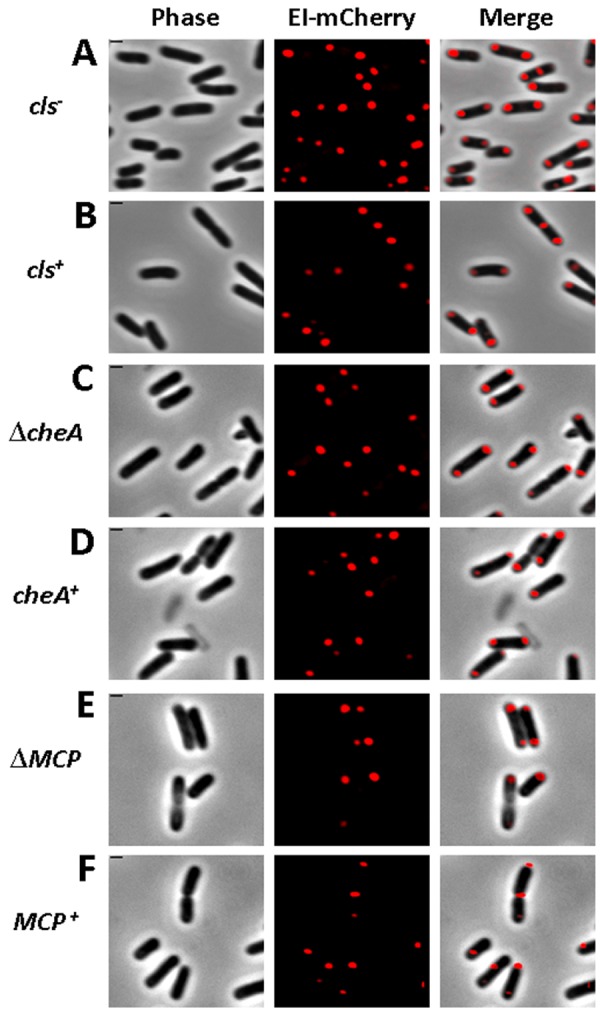
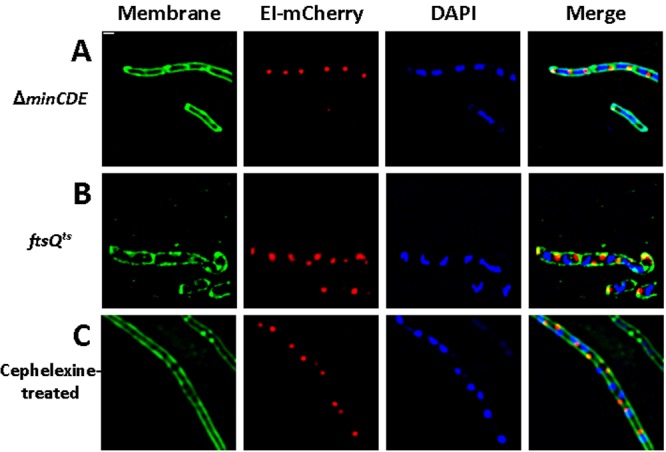
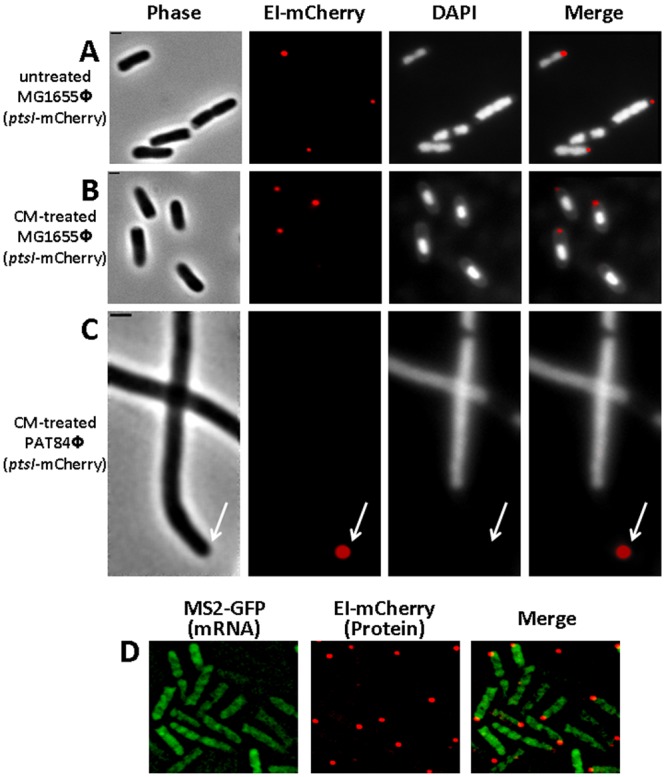
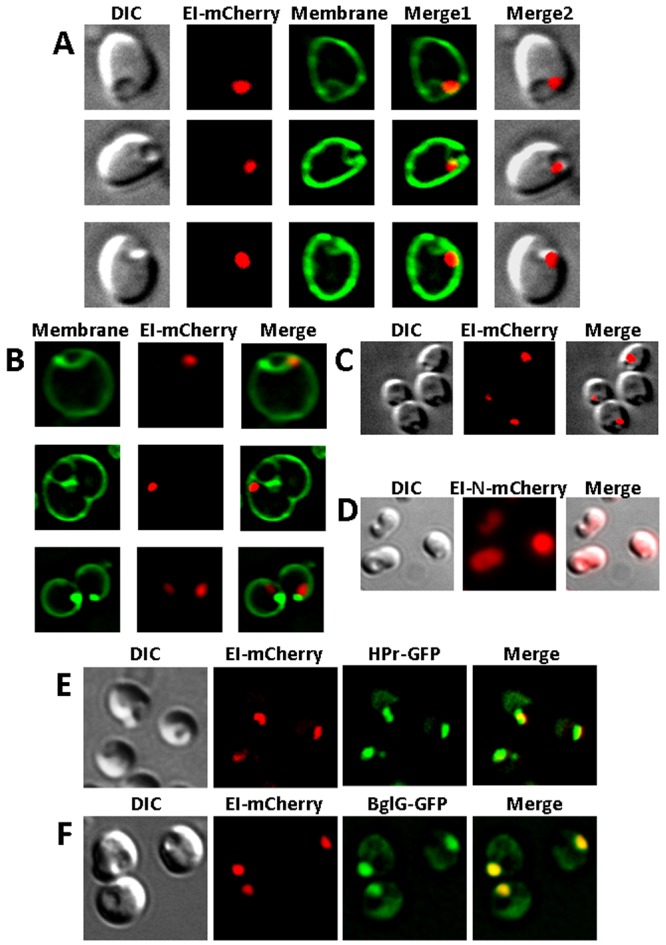
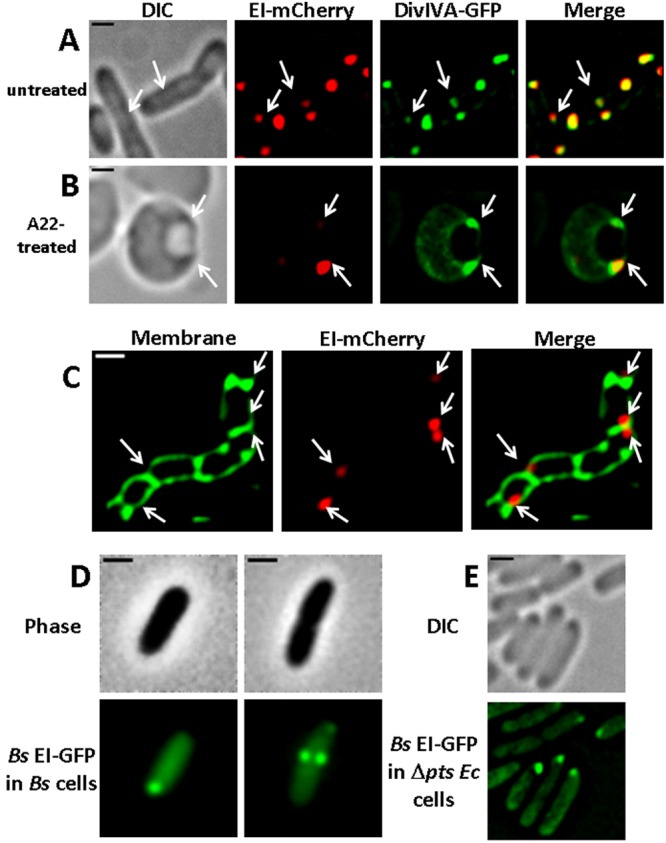
The bacterial cell poles are emerging as subdomains where many cellular activities take place, but the mechanisms for polar localization are just beginning to unravel. The general phosphotransferase system (PTS) proteins, enzyme I (EI) and HPr, which control preferential use of carbon sources in bacteria, were recently shown to localize near the Escherichia coli cell poles. Here, we show that EI localization does not depend on known polar constituents, such as anionic lipids or the chemotaxis receptors, and on the cell division machinery, nor can it be explained by nucleoid occlusion or localized translation. Detection of the general PTS proteins at the budding sites of endocytotic-like membrane invaginations in spherical cells and their colocalization with the negative curvature sensor protein DivIVA suggest that geometric cues underlie localization of the PTS system. Notably, the kinetics of glucose uptake by spherical and rod-shaped E. coli cells are comparable, implying that negatively curved "pole-like" sites support not only the localization but also the proper functioning of the PTS system in cells with different shapes. Consistent with the curvature-mediated localization model, we observed the EI protein from Bacillus subtilis at strongly curved sites in both B. subtilis and E. coli. Taken together, we propose that changes in cell architecture correlate with dynamic survival strategies that localize central metabolic systems like the PTS to subcellular domains where they remain active, thus maintaining cell viability and metabolic alertness.

Importance: Despite their tiny size and the scarcity of membrane-bounded organelles, bacteria are capable of sorting macromolecules to distinct subcellular domains, thus optimizing functionality of vital processes. Understanding the cues that organize bacterial cells should provide novel insights into the complex organization of higher organisms. Previously, we have shown that the general proteins of the phosphotransferase system (PTS) signaling system, which governs utilization of carbon sources in bacteria, localize to the poles of Escherichia coli cells. Here, we show that geometric cues, i.e., strong negative membrane curvature, mediate positioning of the PTS proteins. Furthermore, localization to negatively curved regions seems to support the PTS functionality.


Figures

FIG 1
FIG 1
Polar localization of EI does not depend on cardiolipin and the chemotaxis complex. Images showing EI-mCherry distribution in WC3899 E. coli cells mutated in the cardiolipin synthase (cls) gene (A) compared to the parental W3899 cls+ strain (B) and in AW546 ∆cheA E. coli cells deleted for the cheA gene (C) or in UU2612 E. coli cells deleted of all chemotaxis receptors (E) compared to their respective parental strains AW546 and RP437 (D and F, respectively). The mCherry fusion protein was observed by fluorescence microscopy (red), and the cells were observed with phase microscopy (gray). Also, overlays of the signals from the fluorescence and phase microscopy are shown (merge). Scale bar corresponds to 1 µm.
FIG 2
FIG 2
EI localizes to the budding site of the nonmature septum in filamentous nondividing cells. Fluorescence microscopy images showing EI-mCherry distribution (red) in PB114 E. coli cells carrying a ΔminCDE mutation (A), in MCQ1 E. coli cells carrying an ftsQ1ts mutation that were grown in the restrictive temperature (B), and in MG1655 E. coli wild-type cells treated with cephalexin (C). Membrane staining was with MTG (green), and DNA staining was with DAPI (blue). Overlays of the fluorescent signals are also shown (merge). Scale bar corresponds to 1 µm.
FIG 3
FIG 3
Nucleoid occlusion and localized translation do not account for EI polar localization. (A to C) Images showing EI-mCherry distribution in MG1655Φ(ptsI-mCherry) wild-type E. coli cells untreated (A) or treated with 150 µg/ml chloramphenicol for 20 min (B) and in PAT84Φ(ptsI-mCherry) ftsZ844ts mutant cells that were shifted to the nonpermissive temperature (42°C) and treated with 150 µg/ml chloramphenicol for 20 min. The cells were observed with phase microscopy (gray), the mCherry fusion protein was observed by fluorescence microscopy (red), and DNA staining was with DAPI (white). (D) Fluorescence microscopy images of cells expressing the MS2-GFP protein (green) and an EI-mCherry fusion (red), whose encoding RNA transcripts are tagged with six repeats of the MS2-binding sites. Overlays of the fluorescent signals in panels A to D are also shown (merge). The arrow indicates the pole region. The scale bar corresponds to 1 µm.
FIG 4
FIG 4
Spatial distribution of EI, HPr, and BglG in spherical E. coli cells and their colocalization. (A to C) Images showing the following E. coli strains expressing EI-mCherry from a plasmid (A and B) or from the chromosome (C): A22-treated PA340 (A), PA340-678 ΔmreBCD (B), A22-treated MG1655Φ(ptsI-mCherry) (C). (D) Images of A22-treated MG1655 E. coli cells expressing EI-N-mCherry. (E and F) Images of MG1655 Δpts E. coli cells expressing EI-mCherry together with either HPr-GFP (E) or BglG-GFP (F). The mCherry and GFP fusion proteins were observed by fluorescence microscopy (red and green, respectively), and the cells were observed with DIC (gray). Membrane staining was with MTG (green). Overlays of the fluorescent signals and DIC microscopy (A, C, and D) or of the fluorescent signals (E and F) are also shown (merge).
FIG 5
FIG 5
The E. coli EI protein and the B. subtilis DivIVA and EI proteins show similar localization patterns. (A and B) Images showing the distribution pattern of the E. coli EI protein fused to mCherry and the B. subtilis DivIVA protein fused to GFP in wild-type E. coli cells untreated (A) or treated with A22 (B). (C) Images showing EI-mCherry in MHD63, a murein hydrolase E. coli mutant. (D and E) Images showing the distribution pattern of the B. subtilis EI protein fused to GFP in wild-type B. subtilis (Bs) cells (D) and in ∆pts E. coli (Ec) cells (E). The cells were observed with phase microscopy or DIC (gray), and the mCherry and GFP fusion proteins were observed by fluorescence microscopy (red and green, respectively). Overlays of the fluorescent signals in panels A to C are also shown (merge). Arrows indicate negatively curved regions. The scale bar corresponds to 1 µm.

Similar articles

Cited by

References

    1. Rudner DZ, Losick R. 2010. Protein subcellular localization in bacteria. Cold Spring Harb. Perspect. Biol. 2:a000307 - PMC - PubMed
    1. Nevo-Dinur K, Govindarajan S, Amster-Choder O. 2012. Subcellular localization of RNA and proteins in prokaryotes. Trends Genet. 28:314–322 - PubMed
    1. Toro E, Shapiro L. 2010. Bacterial chromosome organization and segregation. Cold Spring Harb. Perspect. Biol. 2:a000349 - PMC - PubMed
    1. Govindarajan S, Nevo-Dinur K, Amster-Choder O. 2012. Compartmentalization and spatio-temporal organization of macromolecules in bacteria. FEMS Microbiol. Rev. 36:1005–1022 - PubMed
    1. Mileykovskaya E, Dowhan W. 2000. Visualization of phospholipid domains in Escherichia coli by using the cardiolipin-specific fluorescent dye 10-N-nonyl acridine orange. J. Bacteriol. 182:1172–1175 - PMC - PubMed

Publication types

MeSH terms

Substances

LinkOut - more resources