. 2013:4:2602.
doi: 10.1038/ncomms3602.

The genome of Mesobuthus martensii reveals a unique adaptation model of arthropods

Affiliations

The genome of Mesobuthus martensii reveals a unique adaptation model of arthropods

Zhijian Cao et al. Nat Commun. 2013.

Abstract

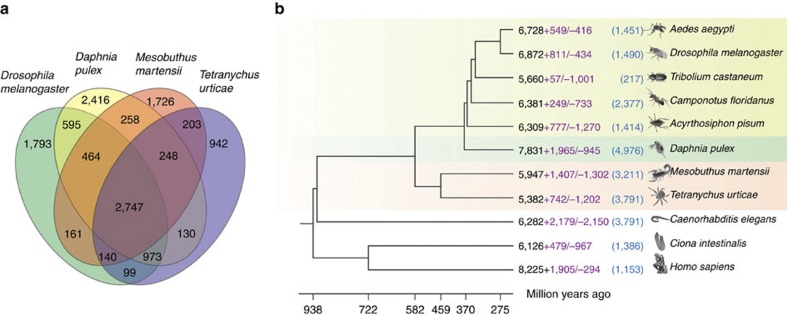
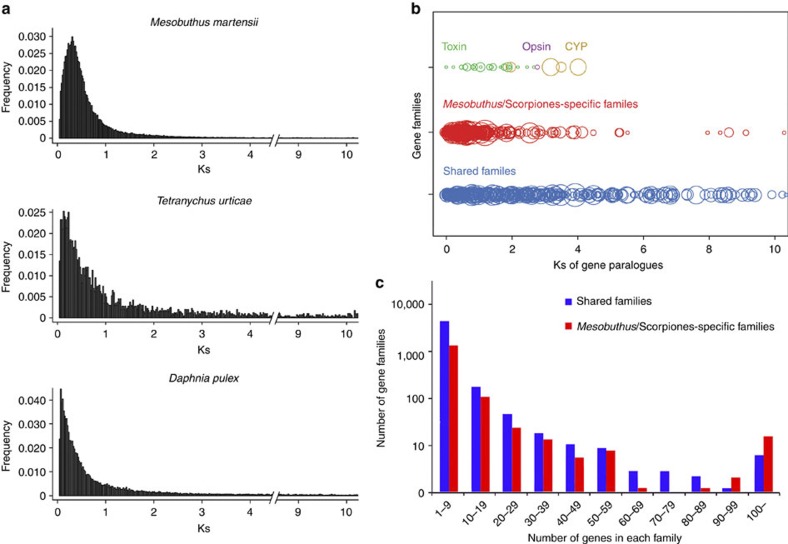
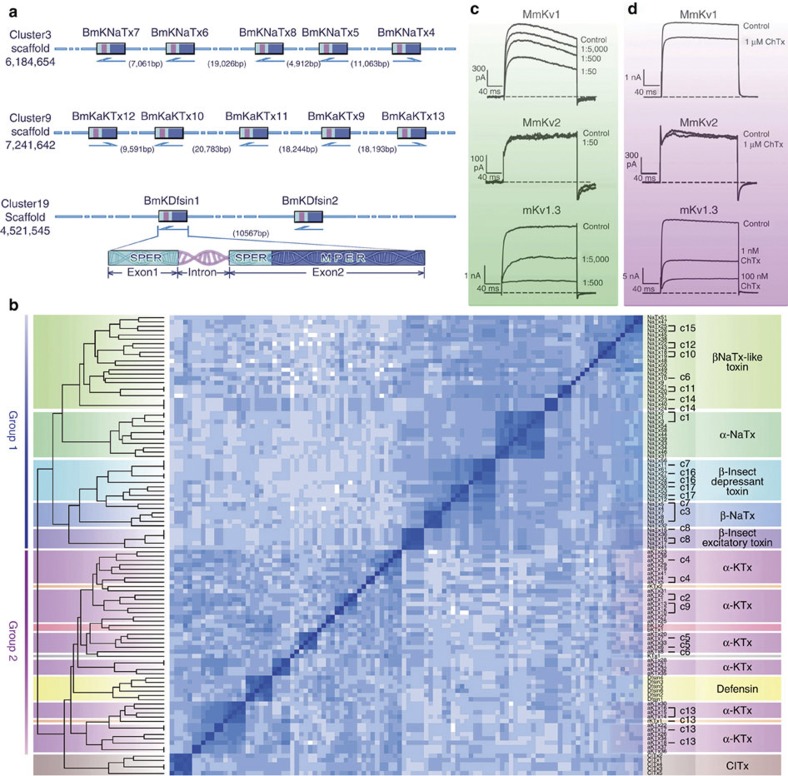
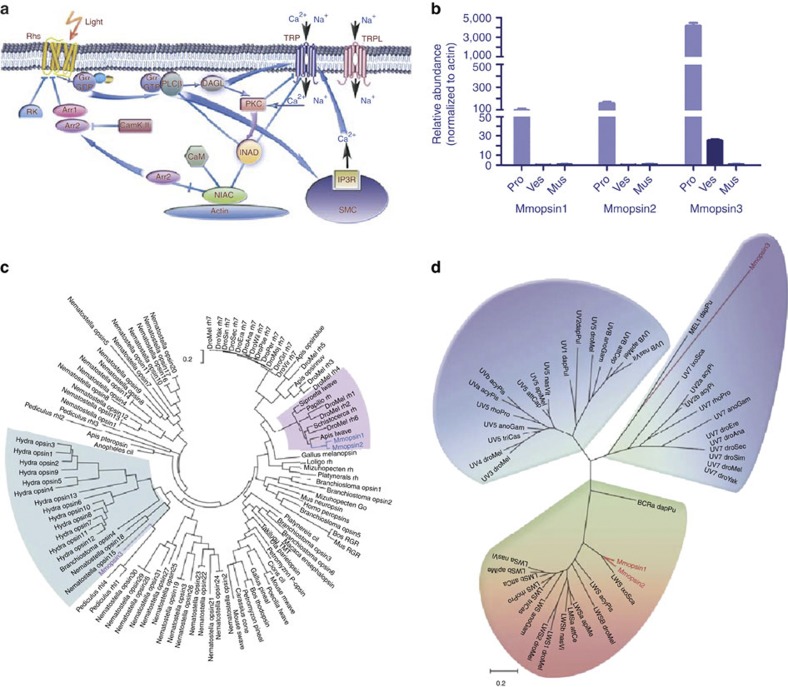
Representing a basal branch of arachnids, scorpions are known as 'living fossils' that maintain an ancient anatomy and are adapted to have survived extreme climate changes. Here we report the genome sequence of Mesobuthus martensii, containing 32,016 protein-coding genes, the most among sequenced arthropods. Although M. martensii appears to evolve conservatively, it has a greater gene family turnover than the insects that have undergone diverse morphological and physiological changes, suggesting the decoupling of the molecular and morphological evolution in scorpions. Underlying the long-term adaptation of scorpions is the expansion of the gene families enriched in basic metabolic pathways, signalling pathways, neurotoxins and cytochrome P450, and the different dynamics of expansion between the shared and the scorpion lineage-specific gene families. Genomic and transcriptomic analyses further illustrate the important genetic features associated with prey, nocturnal behaviour, feeding and detoxification. The M. martensii genome reveals a unique adaptation model of arthropods, offering new insights into the genetic bases of the living fossils.


Conflict of interest statement

The authors declare no competing financial interests.

Figures

Figure 1
Figure 1. Comparative analyses of the M. martensii genome.
(a) Venn diagram of shared and unique gene families between D. melanogaster, D. pulex, M. martensii and T. urticae. Clusters of orthologous and paralogous gene families are identified by OrthoMCL. (b) Gene gain-and-loss analysis of species across arthropods, nematode and chordates. The branching and the divergence times between lineages are derived from the TimeTree database, and are marked with a scale in million years at the bottom. For each species, total gene families (black), the numbers of gene family gain (+) and loss (−) (purple), and orphan genes (blue) are indicated (Supplementary Note 2).
Figure 2
Figure 2. Gene family expansion and evolution.
(a) Frequency of pair-wise genetic divergence at silent sites (Ks) among gene paralogues from M. martensii, T. urticae and D. pulex. The Ks values for gene pairs with >70 aligned amino acids and identity >70% are calculated using codeml PAML package. (b) Ks distribution of the shared, Mesobuthus lineage-specific, and three functional gene families. Each circle represents a gene family, and the size of a circle signifies the member count of a corresponding family. (c) Distribution of the shared and Mesobuthus lineage-specific gene family sizes.
Figure 3
Figure 3. Diversification of neurotoxin and its receptor genes from M. martensii.
(a) Organization and structure of the representative neurotoxin and defensin gene clusters from M. martensii. Scaffolds 6184654, 7241642 and 4521545 are illustrated. SPER, signal peptide encoding region. MPER, mature peptide encoding region. BmKNaTx, M. martensii sodium channel toxin gene. BmKaKTx, M. martensii alpha potassium channel toxin gene. BmKDfsin, M. martensii defensin gene. (b) A heat-map representation of the hierarchical clustering analysis of neurotoxins and defensins from M. martensii. The analysis is performed using sequence similarity scores from pairwise alignments of neurotoxins and defensins. The dendrogram illustrates the relationship between classes of neurotoxins and defensins, revealing the association of sequence homology groups to the pharmacological classes. c1-17, cluster 1-17. βNaTx-like toxin, beta-type sodium channel neurotoxin-like. α-NaTx, alpha-type sodium channel neurotoxin. β-insect depressant toxin, beta-type depressant insect neurotoxin. β-NaTx, beta-type sodium channel neurotoxin. β-insect excitatory toxin, beta-type excitatory insect neurotoxin. α-KTx, alpha-type potassium channel neurotoxin. ClTx, neurotoxin for chloride channel. (c) Resistance of the M. martensii K+ channels, MmKv1 and MmKv2, to scorpion venom. Effects of the M. martensii venom on MmKv1, MmKv2 and mKv1.3 (murine K+ channel) are shown with 1:50, 1:500 and 1:5,000 dilutions. The inhibitory effect of the venom on MmKv1 is about 100-fold smaller than that on mKv1.3. M. martensii venom has no inhibition on MmKv2. (d) Resistance of the M. martensii K+ channels, MmKv1 and MmKv2, to the scorpion neurotoxin ChTX. 1 μM ChTX inhibits 20% MmKv1 activity and has no inhibition on MmKv2, whereas 1 nM ChTX inhibits 60% mKv1.3 (murine K+ channel) activity. The inhibitory effect of ChTX on MmKv1 is 1,000-fold smaller than that on mKv1.3.
Figure 4
Figure 4. Molecular basis for photosensor function in the scorpion tail.
(a) Pathway of light-sensing signal transduction in the scorpion tail. The signal transduction network is modelled after that of D. melanogaster. The involved signalling molecules are listed in Supplementary Tables S17 and S18. (b) Quantitative expression analysis of opsin genes, Mmopsin1, Mmopsin2 and Mmopsin3, in M. martensii. pro, prosoma; ves, vesicle or venom gland; mus, muscle from chelas and metasomal segments I-V. Data are expressed as the mean±s.d. from three replicates. (c) Phylogenetic relationships among opsins. The phylogenetic tree is constructed with the conserved sequences among opsin proteins, using ML method (MEGA5) (Supplementary Note 5). Mmopsin1 and Mmopsin2 are grouped with those from insects, whereas Mmopsin3 is closely related to opsins from genera Hydra, Branchiostoma and Nematostella. (d) Spectrum bias of the M. martensii opsins. The phylogenetic tree is constructed as in c. Mmopsin3 is a member of short-wavelength (ultraviolet to blue) opsins, but Mmopsin1 and Mmopsin2 belong to long-wavelength opsins.
Figure 5
Figure 5. Detoxification of coumarin and synthesis of fluorescent compounds in M. martensii.
(a) A fluorescent M. martensii under an ultraviolet lamp. (b) Fluorescence spectra of the ethanol extract from M. martensii. Excitation spectra (red) are obtained by monitoring the emission of light at 450 nm (EX450nm), and emission spectra (blue) by monitoring the emission flowing excitation at 340 nm (EM340nm). (c) Identification of coumarin and its derivatives from M. martensii by CAD mass spectrum. Coumarin, 7-hydroxy-coumarin and 4-methyl-7-hydroxy-coumarin are detected from the extract of the M. martensii cuticle by LC-ESI-MS/MS (MRM mode) chromatogram (Supplementary Note 6). Tubes containing chemical standards, coumarin, 7-hydroxy-coumarin and 4-methyl-7-hydroxy-coumarin are shown. The latter two emit blue fluorescence under ultraviolet light.

References

    1. Budd G. E. & Telford M. J. The origin and evolution of arthropods. Nature 457, 812–817 (2009). - PubMed
    1. Regier J. C. et al. Arthropod relationships revealed by phylogenomic analysis of nuclear protein-coding sequences. Nature 463, 1079–1083 (2010). - PubMed
    1. Polis G. A. Introduction Standford University Press (1990).
    1. Dunlop J. A., Tetlie O. E. & Prendini L. Reinterpretation of the Silurian scorpion Proscorpius osborni (Whitfield): integrating data from Palaeozoic and recent scorpions. Palaeontology 51, 303–320 (2008).
    1. Possani L. D., Merino E., Corona M., Bolivar F. & Becerril B. Peptides and genes coding for scorpion toxins that affect ion-channels. Biochimie. 82, 861–868 (2000). - PubMed

Publication types

LinkOut - more resources