

Functional linear models for association analysis of quantitative traits
- PMID: 24130119
- PMCID: PMC4163942
- DOI: 10.1002/gepi.21757
Functional linear models for association analysis of quantitative traits
Abstract
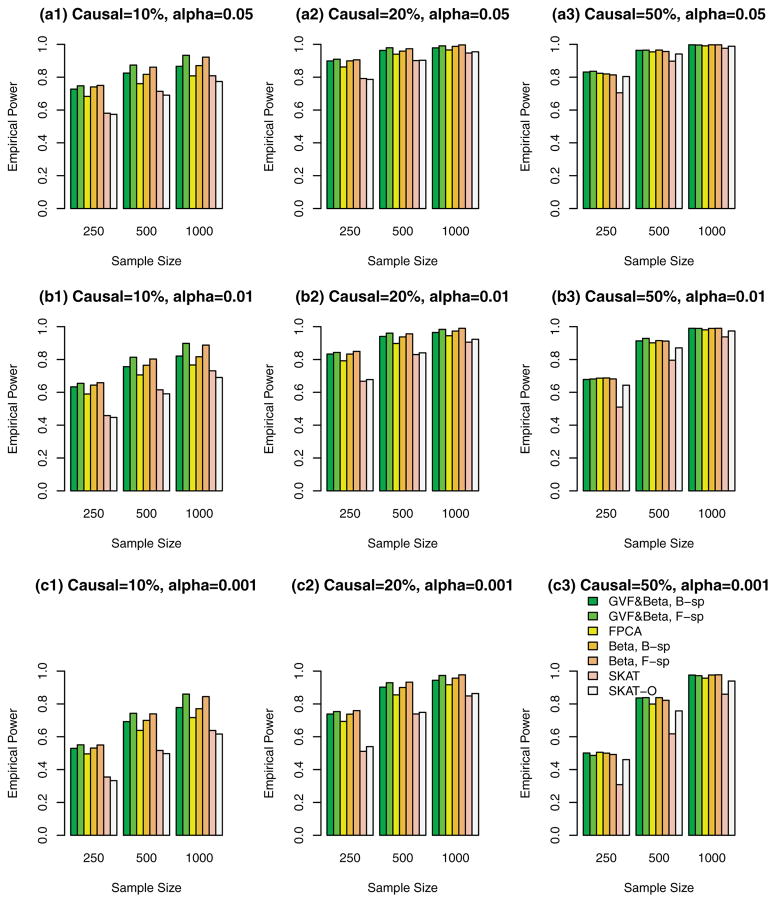
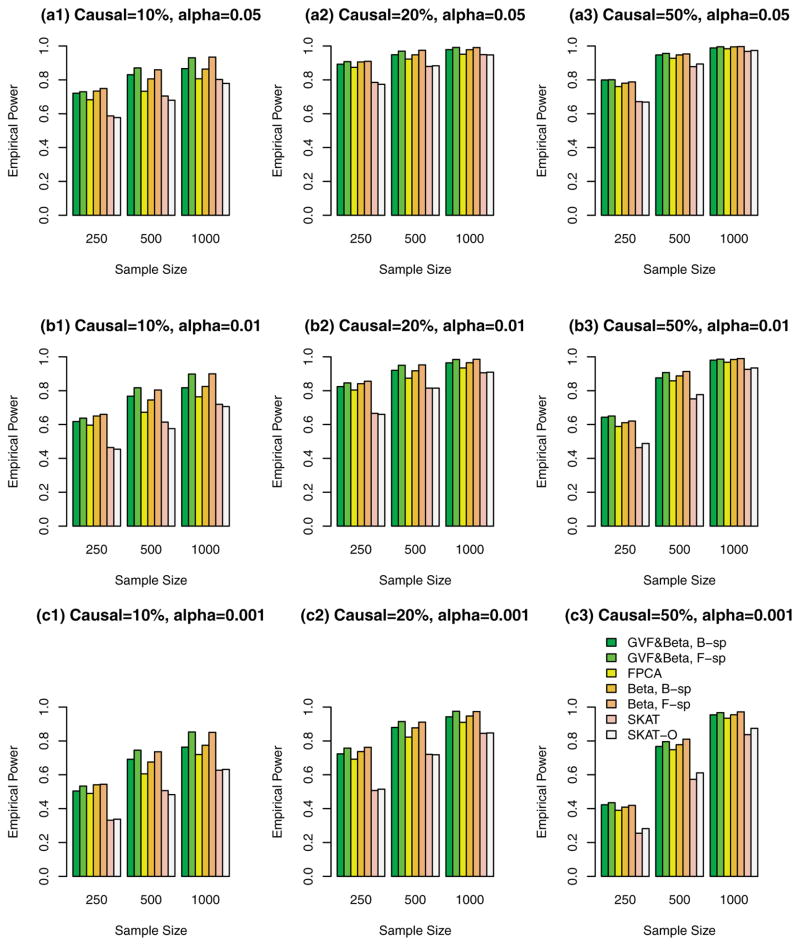
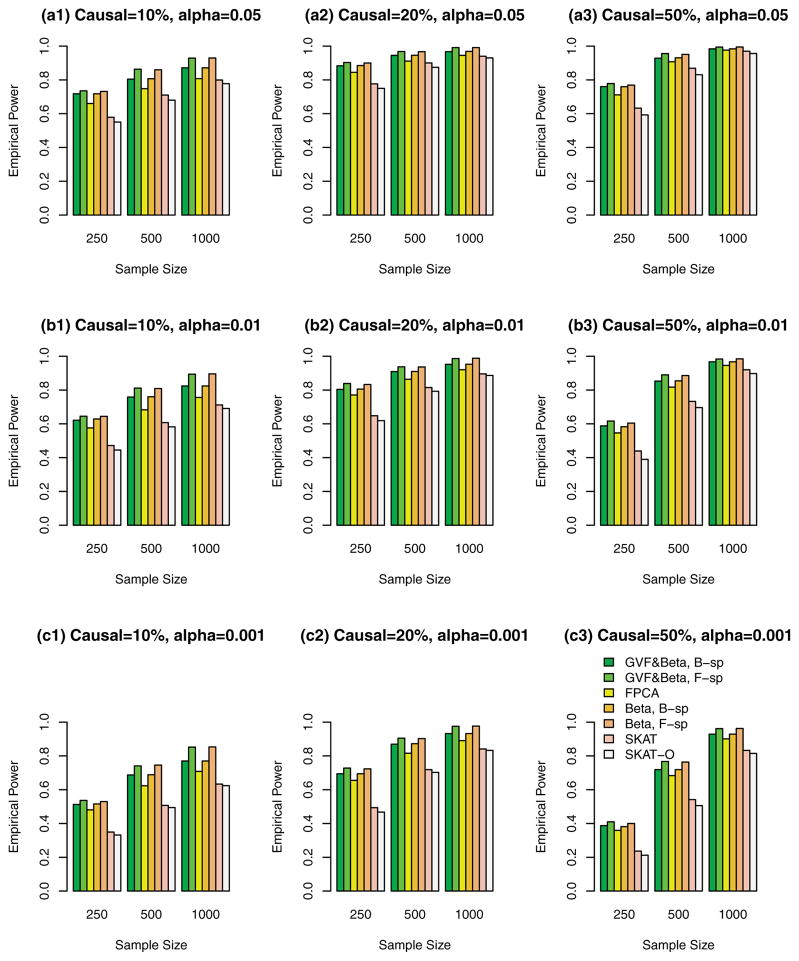
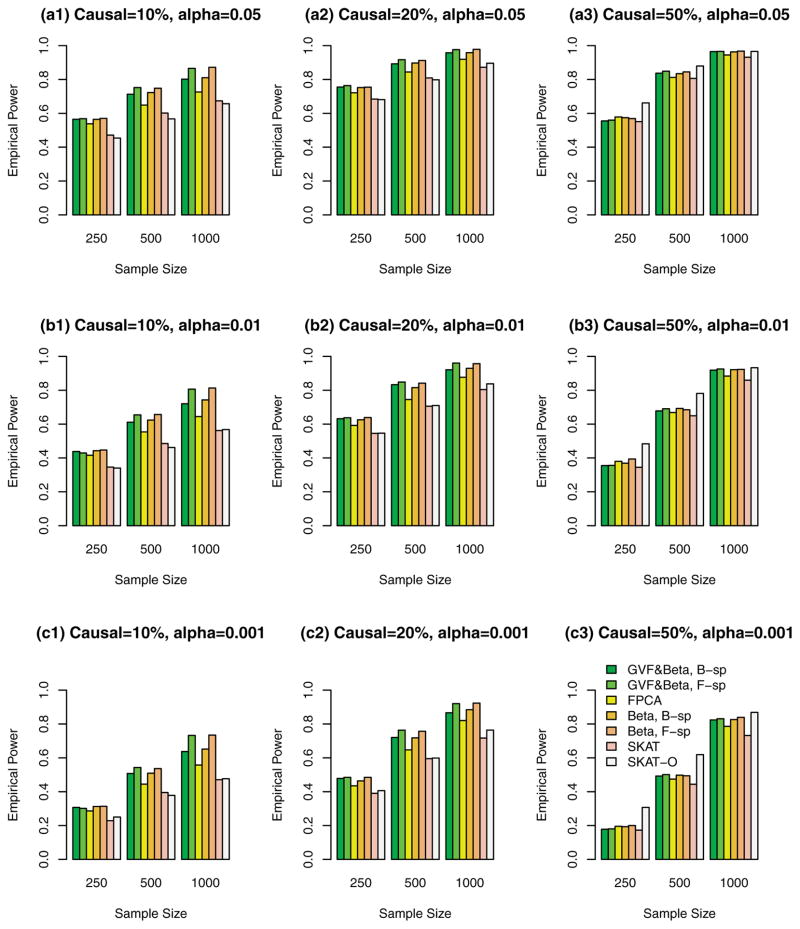
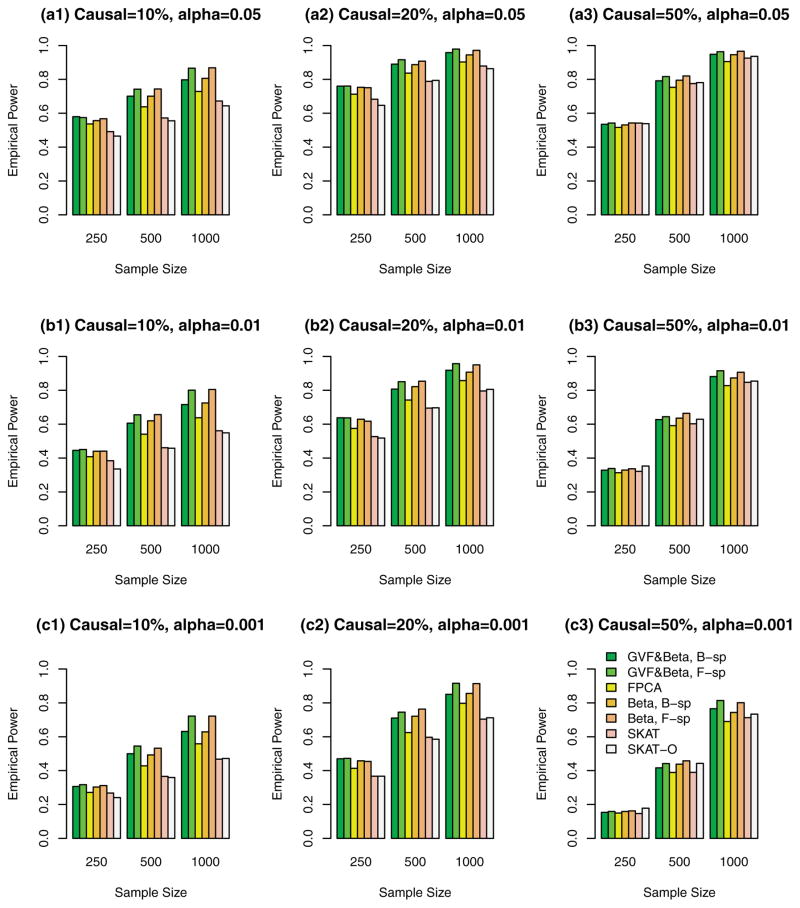
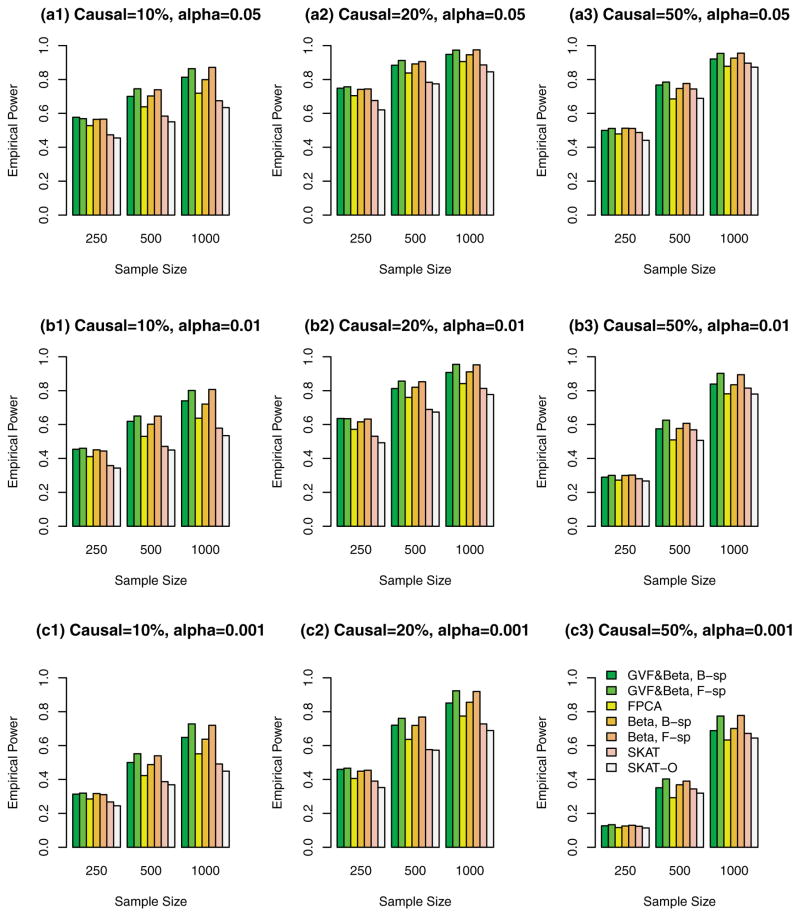
Functional linear models are developed in this paper for testing associations between quantitative traits and genetic variants, which can be rare variants or common variants or the combination of the two. By treating multiple genetic variants of an individual in a human population as a realization of a stochastic process, the genome of an individual in a chromosome region is a continuum of sequence data rather than discrete observations. The genome of an individual is viewed as a stochastic function that contains both linkage and linkage disequilibrium (LD) information of the genetic markers. By using techniques of functional data analysis, both fixed and mixed effect functional linear models are built to test the association between quantitative traits and genetic variants adjusting for covariates. After extensive simulation analysis, it is shown that the F-distributed tests of the proposed fixed effect functional linear models have higher power than that of sequence kernel association test (SKAT) and its optimal unified test (SKAT-O) for three scenarios in most cases: (1) the causal variants are all rare, (2) the causal variants are both rare and common, and (3) the causal variants are common. The superior performance of the fixed effect functional linear models is most likely due to its optimal utilization of both genetic linkage and LD information of multiple genetic variants in a genome and similarity among different individuals, while SKAT and SKAT-O only model the similarities and pairwise LD but do not model linkage and higher order LD information sufficiently. In addition, the proposed fixed effect models generate accurate type I error rates in simulation studies. We also show that the functional kernel score tests of the proposed mixed effect functional linear models are preferable in candidate gene analysis and small sample problems. The methods are applied to analyze three biochemical traits in data from the Trinity Students Study.
Keywords: association mapping; common variants; complex traits; functional data analysis; quantitative trait loci; rare variants.
© 2013 WILEY PERIODICALS, INC.
Figures
Similar articles
-
Generalized functional linear models for gene-based case-control association studies.Genet Epidemiol. 2014 Nov;38(7):622-637. doi: 10.1002/gepi.21840. Epub 2014 Sep 9. Genet Epidemiol. 2014. PMID: 25203683 Free PMC article.
-
A Comparison Study of Fixed and Mixed Effect Models for Gene Level Association Studies of Complex Traits.Genet Epidemiol. 2016 Dec;40(8):702-721. doi: 10.1002/gepi.21984. Epub 2016 Jul 4. Genet Epidemiol. 2016. PMID: 27374056 Free PMC article.
-
Pleiotropy analysis of quantitative traits at gene level by multivariate functional linear models.Genet Epidemiol. 2015 May;39(4):259-75. doi: 10.1002/gepi.21895. Epub 2015 Mar 23. Genet Epidemiol. 2015. PMID: 25809955 Free PMC article.
-
On selecting markers for association studies: patterns of linkage disequilibrium between two and three diallelic loci.Genet Epidemiol. 2003 Jan;24(1):57-67. doi: 10.1002/gepi.10217. Genet Epidemiol. 2003. PMID: 12508256 Review.
-
Fine-mapping genetic associations.Hum Mol Genet. 2020 Sep 30;29(R1):R81-R88. doi: 10.1093/hmg/ddaa148. Hum Mol Genet. 2020. PMID: 32744321 Free PMC article. Review.
Cited by
-
A Multi-Marker Test for Analyzing Paired Genetic Data in Transplantation.Front Genet. 2021 Oct 13;12:745773. doi: 10.3389/fgene.2021.745773. eCollection 2021. Front Genet. 2021. PMID: 34721531 Free PMC article. Review.
-
Meta-analysis of Complex Diseases at Gene Level with Generalized Functional Linear Models.Genetics. 2016 Feb;202(2):457-70. doi: 10.1534/genetics.115.180869. Epub 2015 Dec 29. Genetics. 2016. PMID: 26715663 Free PMC article.
-
Generalized functional linear models for gene-based case-control association studies.Genet Epidemiol. 2014 Nov;38(7):622-637. doi: 10.1002/gepi.21840. Epub 2014 Sep 9. Genet Epidemiol. 2014. PMID: 25203683 Free PMC article.
-
A Comparison Study of Fixed and Mixed Effect Models for Gene Level Association Studies of Complex Traits.Genet Epidemiol. 2016 Dec;40(8):702-721. doi: 10.1002/gepi.21984. Epub 2016 Jul 4. Genet Epidemiol. 2016. PMID: 27374056 Free PMC article.
-
sumSTAAR: A flexible framework for gene-based association studies using GWAS summary statistics.PLoS Comput Biol. 2022 Jun 2;18(6):e1010172. doi: 10.1371/journal.pcbi.1010172. eCollection 2022 Jun. PLoS Comput Biol. 2022. PMID: 35653402 Free PMC article.
References
-
- Clarke J, Wu HC, Jayasinghe L, Patel A, Reid S, Bayley H. Continuous base identification for single-molecule nanopore DNA sequencing. Nat Nanotechnol. 2009;4:265–270. - PubMed
-
- Davies R. The distribution of a linear combination of chi-square random variables. J R Stat Soc Ser C Appl Stat. 1980;29:323–333.
Publication types
MeSH terms
Substances
Grants and funding
LinkOut - more resources
Full Text Sources
Other Literature Sources
Research Materials
