Influence of apolipoproteins on the association between lipids and insulin sensitivity: a cross-sectional analysis of the RISC Study
- PMID: 24130363
- PMCID: PMC3836122
- DOI: 10.2337/dc13-0682
Influence of apolipoproteins on the association between lipids and insulin sensitivity: a cross-sectional analysis of the RISC Study
Abstract
Objective: We evaluated whether the association of insulin sensitivity with HDL cholesterol (HDL) and triglycerides is influenced by major plasma apolipoproteins, as suggested by recent experimental evidence.
Research design and methods: This study included a cross-sectional analysis of the RISC Study, a multicenter European clinical investigation in 1,017 healthy volunteers balanced in sex (women 54%) and age strata (range 30-60 years). Insulin sensitivity (M/I in µmol ⋅ min(-1) ⋅ kgFFM(-1) ⋅ nM(-1)) was measured by the clamp technique and apolipoproteins (ApoB, -C3, -A1, and -E) by Multiplex Technology.
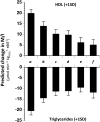
Results: The center-, sex-, and age-adjusted standardized regression coefficients (STDβ) with M/I were similar for HDL and triglycerides (+19.9 ± 1.9 vs. -20.0 ± 2.0, P < 0.0001). Further adjustment for triglycerides (or HDL), BMI, and adiponectin (or nonesterified fatty acid) attenuated the strength of the association of M/I with both HDL (STDβ +6.4 ± 2.3, P < 0.01) and triglycerides (-9.5 ± 2.1, P < 0.001). Neither ApoA1 nor ApoE and ApoB showed any association with M/I independent from plasma HDL cholesterol and triglycerides. ApoC3, in contrast, in both men and women, was positively associated with M/I independently of plasma lipids. A relative enrichment of plasma lipids with ApoC3 is associated with lower body fat percentage and lower plasma alanine amino transferase.
Conclusions: Our results suggest that HDL cholesterol modulates insulin sensitivity through a mechanism that is partially mediated by BMI and adiponectin but not by ApoA1. Similarly, the influence of triglycerides on insulin sensitivity is in part mediated by BMI and is unrelated to ApoE or ApoB, but it is significantly modulated by ApoC3, which appears to protect from the negative effect of plasma lipids.
Figures


References
-
- Chahil TJ, Ginsberg HN. Diabetic dyslipidemia. Endocrinol Metab Clin North Am 2006;35:491–510, vii–viii - PubMed
-
- Van Linthout S, Foryst-Ludwig A, Spillmann F, et al. Impact of HDL on adipose tissue metabolism and adiponectin expression. Atherosclerosis 2010;210:438–444 - PubMed
-
- Yamauchi T, Kamon J, Ito Y, et al. Cloning of adiponectin receptors that mediate antidiabetic metabolic effects. Nature 2003;423:762–769 - PubMed
Publication types
MeSH terms
Substances
LinkOut - more resources
Full Text Sources
Other Literature Sources
Medical
Miscellaneous

