Review
. 2014 Jan;42(1):9-22.
doi: 10.1124/dmd.113.054627. Epub 2013 Oct 15.

Correlating structure and function of drug-metabolizing enzymes: progress and ongoing challenges

Affiliations
Review

Correlating structure and function of drug-metabolizing enzymes: progress and ongoing challenges

Eric F Johnson et al. Drug Metab Dispos. 2014 Jan.

Abstract

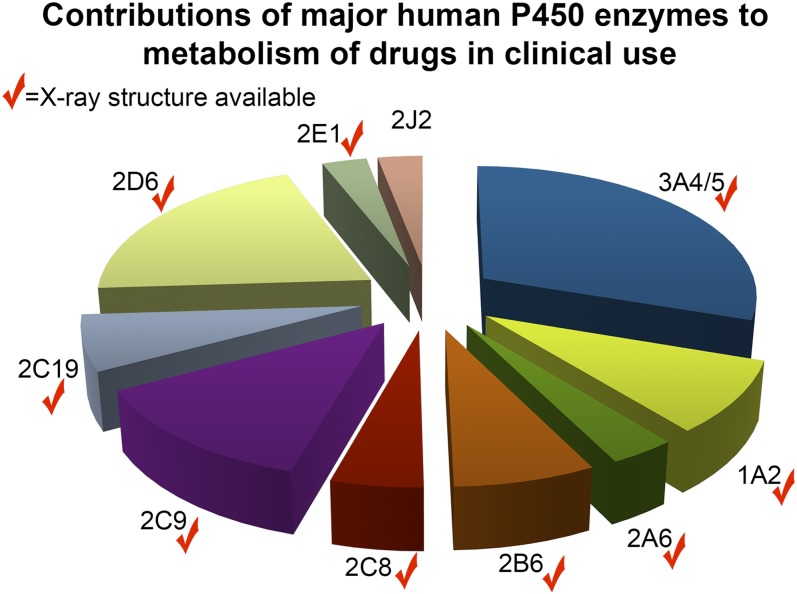
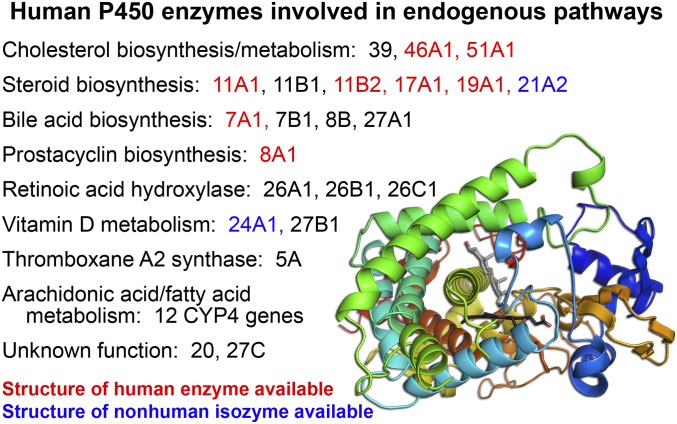
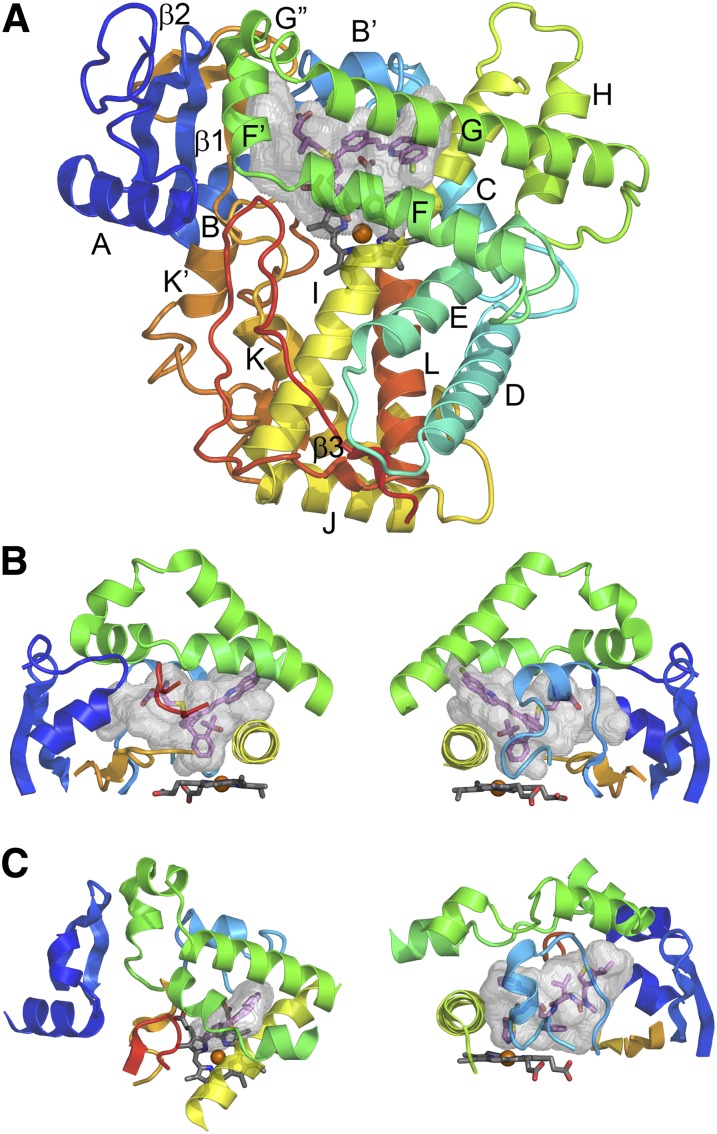
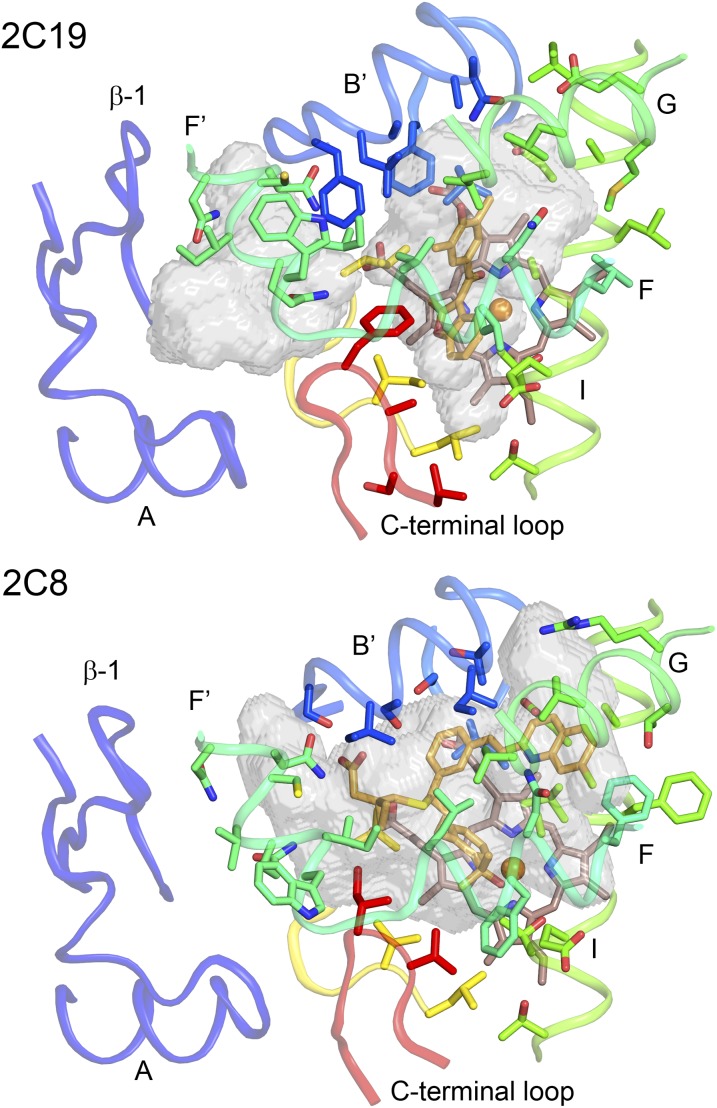
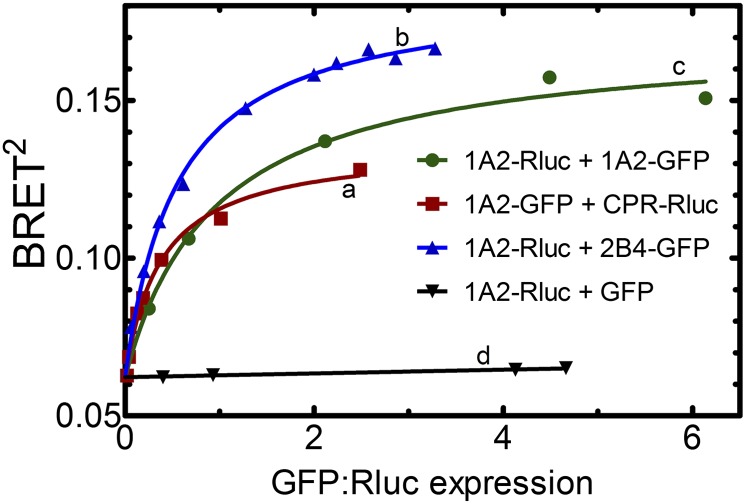
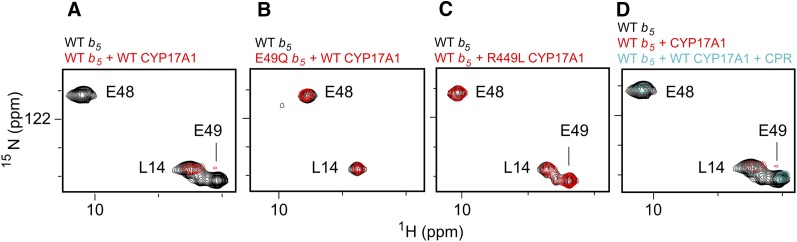
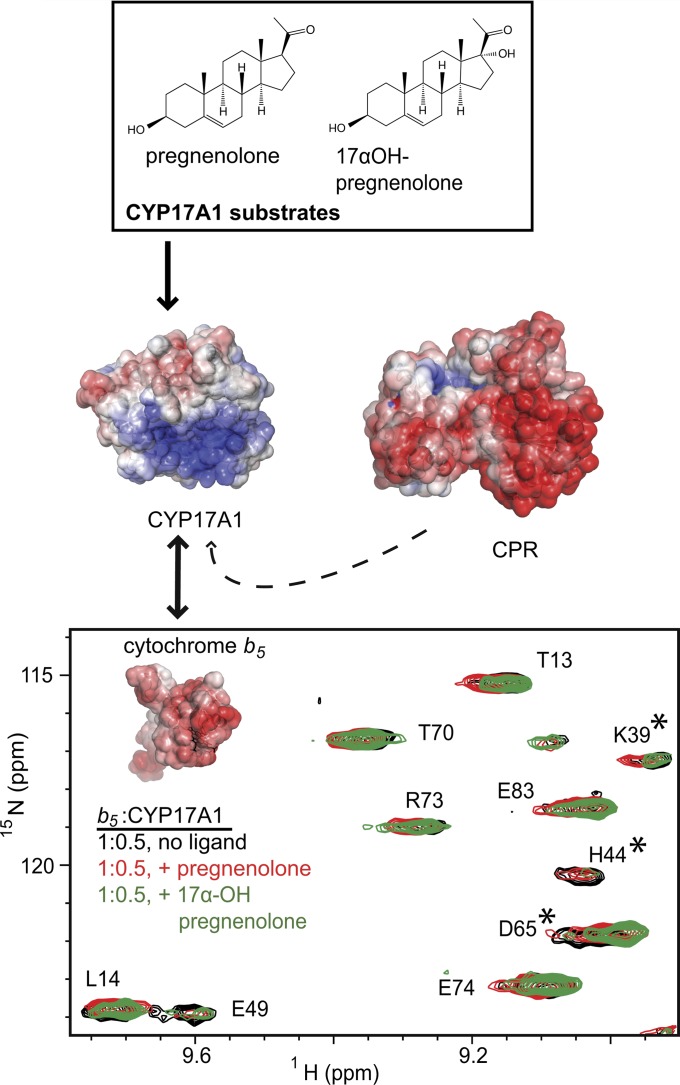
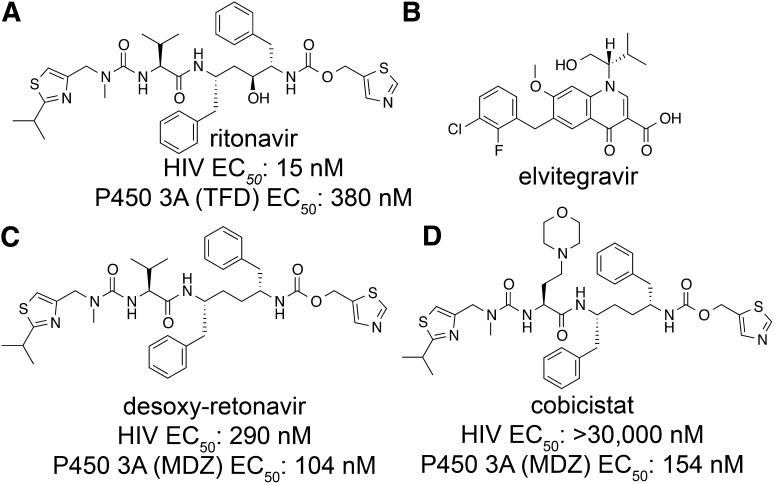
This report summarizes a symposium sponsored by the American Society for Pharmacology and Experimental Therapeutics at Experimental Biology held April 20-24 in Boston, MA. Presentations discussed the status of cytochrome P450 (P450) knowledge, emphasizing advances and challenges in relating structure with function and in applying this information to drug design. First, at least one structure of most major human drug-metabolizing P450 enzymes is known. However, the flexibility of these active sites can limit the predictive value of one structure for other ligands. A second limitation is our coarse-grain understanding of P450 interactions with membranes, other P450 enzymes, NADPH-cytochrome P450 reductase, and cytochrome b5. Recent work has examined differential P450 interactions with reductase in mixed P450 systems and P450:P450 complexes in reconstituted systems and cells, suggesting another level of functional control. In addition, protein nuclear magnetic resonance is a new approach to probe these protein/protein interactions, identifying interacting b5 and P450 surfaces, showing that b5 and reductase binding are mutually exclusive, and demonstrating ligand modulation of CYP17A1/b5 interactions. One desired outcome is the application of such information to control drug metabolism and/or design selective P450 inhibitors. A final presentation highlighted development of a CYP3A4 inhibitor that slows clearance of human immunodeficiency virus drugs otherwise rapidly metabolized by CYP3A4. Although understanding P450 structure/function relationships is an ongoing challenge, translational advances will benefit from continued integration of existing and new biophysical approaches.


Figures

Fig. 1.
Fig. 1.
Major human drug-metabolizing P450 enzymes by percentage of clinically used drugs that each metabolizes. Data from (Zanger and Schwab, 2013). Checkmarks indicate enzymes for which at least one structure is present in the Protein Data Bank.
Fig. 2.
Fig. 2.
Numerous human endogenous pathways include one or more cytochrome P450 enzymes. Those for which structures of the human enzyme are known are in red; those with structures of mammalian homologs are in blue; while those without structures are in black. Lower right inset, structure of CYP17A1 with the prostate cancer drug abiraterone (gray sticks) above the heme prosthetic group (black sticks) displays the common P450 structural elements colored from the N-terminus (blue) to the C-terminus (red).
Fig. 3.
Fig. 3.
P450 secondary and tertiary structure. (A) Topological features of a microsomal P450 as illustrated by the Protein Data Bank:2NNI structure of human microsomal 2C8 colored from blue at the N-terminus to red at the C-terminus. The active site cavity is shown as a transparent surface. The bound substrate, montelukast (violet carbons), and the heme prosthetic group (gray carbons) are shown as stick figures. Twelve helices designated by letters A–L and β-sheets 1 and 2 are highly conserved. Additional helices are evident that are named by letters with prime or double prime designations. (B) Two views of structural components that form the sides of the substrate binding site of 2C8. The F–G region (green) forms the top of the cavity and is cantilevered over helix I (yellow) which forms one side. The opposite side is formed by connections (orange) between helix K and β1–3 and between β1–4 and helix K' near the surface of the heme, and by the N-terminal region (dark blue) that includes helix A and β-1. The gaps under the helix F–G region between helix I and the N-terminal region are filled by the C-terminal loop (red orange) as shown in the left panel and by the B–C loop (light blue) as shown in the right panel. (C) A view of the helix F–G side of human 1A2 α-napthoflavone complex, PDB:2HI4 (left) and of the B–C loop side of the human 3A4 ritonavir complex, Protein Data Bank:3NXU (right) illustrates differences in the topologies of the active sites and the secondary and tertiary structures of the three proteins. This figure was originally published in Johnson EF and Stout CD (2013) Structural diversity of eukaryotic membrane cytochrome P450s. J Biol Chem 288:17082–17090. ©The American Society for Biochemistry and Molecular Biology.
Fig. 4.
Fig. 4.
Comparison of the active site cavities of 2C19 complexed with (2-methyl-1-benzofuran-3-yl)-(4-hydroxy-3,5-dimethylphenyl)methanone (Protein Data Bank:4GQS) and 2C8 complexed with montelukast (Protein Data Bank:2NNI). Differences in the sizes, shapes, and polarity of the amino acid side-chains lining the two cavities lead to changes in the shapes of the cavities and to the presence of two cavities in 2C19. Carbons are colored from blue at the N-terminus to red at the C-terminus for the proteins. Ligand and heme carbons are colored orange and brown, respectively. Oxygen, nitrogen, chlorine, sulfur, and iron are colored red, blue, green, yellow, and orange, respectively. The active sites and antechamber are shown as transparent surfaces.
Fig. 5.
Fig. 5.
The active site cavities (mesh surface) of the P450 2C19 complex (A) with (2-methyl-1-benzofuran-3-yl)-(4-hydroxy-3,5-dimethylphenyl)methanone (Protein Data Bank:4GQS) and of the 2C9 complex (B) with flurbiprofen (Protein Data Bank:1R9O). Amino acid residues that contribute to differential substrate selectivity and/or that directly shape the distal portions of the cavity are displayed as sticks with carbons colored light blue and pale green, respectively. Ligand and heme carbons are colored yellow and brown, respectively. Oxygen, nitrogen, fluorine, and iron are colored red, blue, purple, and orange. Water molecules are represented as a red spheres; hydrogen bonds are represented by dashed lines. This figure was originally published in Reynald RL, Sansen S, Stout CD, and Johnson EF (2012) Structural characterization of human cytochrome P450 2C19: Active site differences between P450's 2C8, 2C9 and 2C19. J Biol Chem 287:44581–44591. ©The American Society for Biochemistry and Molecular Biology.
Fig. 6.
Fig. 6.
The substrate binding site of 2D6 complexed with two molecules of thioridazine (PDB:3TBG). Simultaneous binding of two molecules leads to an open active site cavity with one thioridazine molecule bound close to the heme with its charged, protonated nitrogen forming an ionic bond with Asp301 on helix I. The second thioridazine molecule is bound in the open entrance channel with the protonated nitrogen forming an ionic bond with Asp222. Two additional charged amino acids in the 2D6 active site, Glu216 and Arg221, exhibit favorable ionic interactions in this complex. Protein, ligand, and heme carbons are colored cyan, magenta, and brown, respectively. Heteroatoms are colored as described in the previous figure legends.
Fig. 7.
Fig. 7.
Illustration of the experimental protocol for examining the interactions between multiple P450 enzymes. Vesicles contain CYP1A2 and CPR, CYP2B4 and CPR, or both CYP1A2 and CYP2B4 in the same vesicle as CPR. Reproduced from Reed et al., 2010.
Fig. 8.
Fig. 8.
Stimulation of CYP1A2-selective activities and inhibition of CYP2B4-selective activities upon coreconstitution of both CYP1A2 and CYP2B4 with subsaturating CPR. Both simple reconstituted systems containing a single P450 and subsaturating CPR, and mixed systems containing both CYP1A2 and CYP2B4 and subsaturating CPR were prepared in bovine phosphatidylcholine. The metabolism of CYP1A2-selective (panel A) and CYP2B4-selective (panel B) substrates were then examined. (A) Metabolism of the CYP1A2 substrate 7-ethoxyresorufin was synergistically stimulated when CYP1A2, CYP2B4, and CPR were coreconstituted in the same vesicle (1A2 w/2B4 w/CPR). Such stimulation was not observed when CYP1A2/CPR vesicles were mixed with CYP2B4/CPR vesicles (CPR-CYP1A2 + CPR-CYP2B4). Controls include simple systems containing CYP2B4 and CPR (2B4 + CPR), CYP1A2 and CPR (1A2 + CPR). An additional control is shown where CYP1A2 and CPR were reconstituted into separate vesicles (CPR-PC + 1A2-PC), demonstrating that both proteins must be in the same vesicle to function. (B) Metabolism of the CYP2B4 substrate 7-ethoxy-4-trifluoromethylcoumarin was inhibited in mixed reconstituted systems containing CPR and both P450s (1A2-2B4-CPR), but not when the proteins were present in separate vesicles (2B4-CPR + 1A2-CPR). The following reconstituted systems were: simple system containing 2B4 and CPR (2B4-CPR), simple system containing 1A2 and CPR (1A2-CPR), the arithmetic sum of the rates from the 1A2-CPR + 2B4-CPR systems (SUM), the mixing of the two simple reconstituted systems (2B4-CPR + 1A2-CPR), reconstitution of CPR, CYP1A2, and CYP2B4 in the same vesicles (1A2-2B4-CPR), and mixing of a CPR in one vesicle (CPR-PC) and CYP2B4 (2B4-PC) in another vesicle. Adapted from Reed et al., 2010.
Fig. 9.
Fig. 9.
A model that is consistent with the kinetic data supporting the concept of the formation of P450-P450 complexes. When CPR is at subsaturating concentrations, it selectively associates with the CYP1A2 moiety of the CYP1A2•CYP2B4 complex.
Fig. 10.
Fig. 10.
Demonstration of heteromeric CYP1A2•CYP2B4 complexes in reconstituted systems. Four distinct reconstituted systems were generated, two simple systems containing either CYP1A2 or CYP2B4, a combination of the separate vesicle systems (1A2 + 2B4), or a mixed reconstituted system containing equimolar concentrations of CYP1A2 and CYP2B4 in the same vesicles. These systems were first cross-linked with bis(sulfosuccinimidyl) suberate, then immunoprecipitated with CYP1A2 antibody, and finally immunoblotted with anti-CYP2B4 antibody. Higher molecular weight complexes (labeled as dimer, trimer, and tetramer) were observed only when both P450 enzymes were present in a common membrane. The “1A2 antibody” lane is a control generated without any reconstituted system. The molecular weight standard (MW std) has the masses of the bands indicated. Adapted from Reed et al., 2010.
Fig. 11.
Fig. 11.
Demonstration of the existence of P450-P450 complexes in living cells using bioluminescence resonance energy transfer. Vectors were created containing CYP1A2, CYP2B4, or CPR cDNA upstream of either GFP or Rluc so that the resultant fusion proteins contained a C-terminal tag. These vectors (one -Rluc and one -GFP) were transfected into human embryonic kidney 293T cells to coexpress the fusion proteins at a variety of GFP-to-Rluc ratios. A hyperbolic increase in BRET signal (BRET2, measured as the ratio of the 510 nm GFP fluorescence/410 nm Rluc luminescence) is indicative of specific complexes between the proteins. Interaction between CYP1A2 and CPR was detected as a BRET signal after the cotransfection of CYP1A2-GFP and CPR-Rluc (curve a). Formation of homomeric CYP1A2 complexes is shown by the BRET response generated by cotransfection of CYP1A2-Rluc and CYP1A2-GFP (curve b). Formation of the heteromeric CYP1A2•CYP2B4 complex is shown by cotransfection of CYP1A2-Rluc with CYP2B4-GFP (curve c). A control curve showing a lack of complex formation was generated by cotransfecting CYP1A2-Rluc and GFP (without a P450 attached) (curve d). Curves b and d are reproduced from Reed et al., 2012.
Fig. 12.
Fig. 12.
Examples of NMR spectra establishing contact surfaces between CYP17A1 and b5 and the mutually exclusive nature of b5 and CPR binding. (A) Comparison between the HSQC of uniformly 15N-labeled b5 alone (black) and a 1:1 mixture with unlabeled CYP17A1 (red) demonstrates that selected resonances in/near the b5 α helix two are broadened and disappear (e.g., E48 and E49, but not L14), suggesting the glutamic acid residues are involved in the CYP17A1/b5 interaction. (B) When b5 residues involved in the interaction with CYP17A1 are mutated (e.g., E49Q, red spectrum), the same resonances for residues in the b5 α helix two are not broadened compared with the 15N-b5 spectrum alone (black), suggesting the CYP17A1/b5 complex does not form. (C) If residues on the CYP17A1 proximal surface known to impair b5 facilitation of the CYP17A1 lyase reaction are mutated (e.g., CYP17A1 R449L, red spectrum), the mutant CYP17A1 also does not cause line broadening of b5 residues (compared with the b5 spectum, black). (D) Although the spectrum of wild type b5 alone (black) has selective resonances line broadened upon addition of CYP17A1 (red spectrum), the subsequent addition of CPR (cyan spectrum) causes these resonances (e.g., E48 and E49) to reappear, suggesting that CPR disrupts CYP17A1 interaction with b5. Adapted from (Estrada et al., 2013).
Fig. 13.
Fig. 13.
Distinct ligands differentially affect the interaction of CYP17A1 with cytochrome b5. Depending on the presence and identity of ligands in the enclosed active site on the distal side of the heme, differential effects are observed in the interactions between the CYP17A1 proximal surface and b5. In the example shown, residues K39, H44, and D65 of b5 (asterisks) are line-broadened or perturbed in a way that is unique to either pregnenolone-bound (red spectrum) or 17α-hydroxypregnenolone-bound (green spectrum) CYP17A1 compared with the unliganded spectrum (black). The addition of rat CPR (dashed arrow), and its ability to displace bound b5 provides an additional tool with which to examine differential ligand effects on the CYP17A1/b5 interaction. Adapted from Estrada et al., 2013.
Fig. 14.
Fig. 14.
Structures of small-molecule compounds. (A) Structure of ritonavir. EC50 is inhibition of terfenadine (TFD) hydroxylase (CYP3A) activity in human liver microsomes. (B) Structure of elvitegravir. (C) Structure and activity of desoxy-ritonavir. (D) Structure and activity of cobicistat. For (C) and (D) EC50 is inhibition of midazolam (MDZ) 1′-hydroxylase by CYP3A.

References

    1. Ahuja S, Jahr N, Im SC, Vivekanandan S, Popovych N, Le Clair SV, Huang R, Soong R, Xu J, Yamamoto K, et al. (2013) A model of the membrane-bound cytochrome b5-cytochrome P450 complex from NMR and mutagenesis data. J Biol Chem 288:22080–22095 - PMC - PubMed
    1. Akhtar MK, Kelly SL, Kaderbhai MA. (2005) Cytochrome b(5) modulation of 17alpha hydroxylase and 17-20 lyase (CYP17) activities in steroidogenesis. J Endocrinol 187:267–274 - PubMed
    1. Asciutto EK, Young MJ, Madura J, Pochapsky SS, Pochapsky TC. (2012) Solution structural ensembles of substrate-free cytochrome P450(cam). Biochemistry 51:3383–3393 - PMC - PubMed
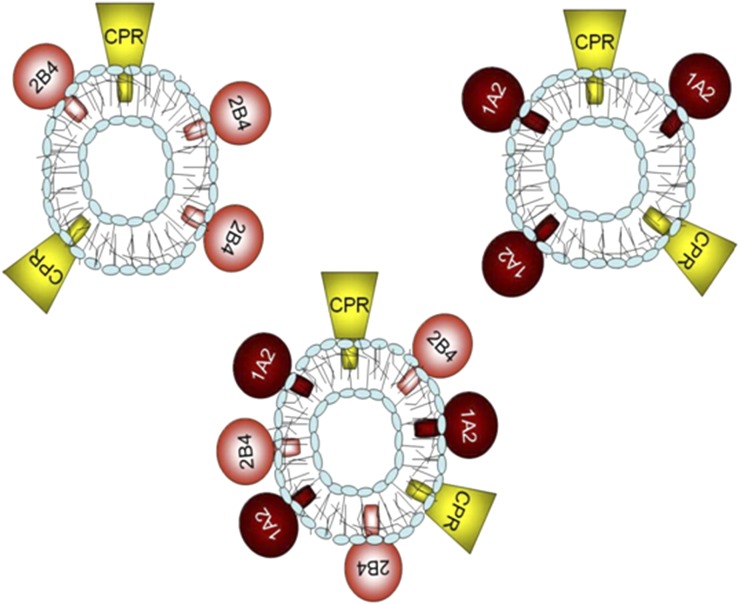
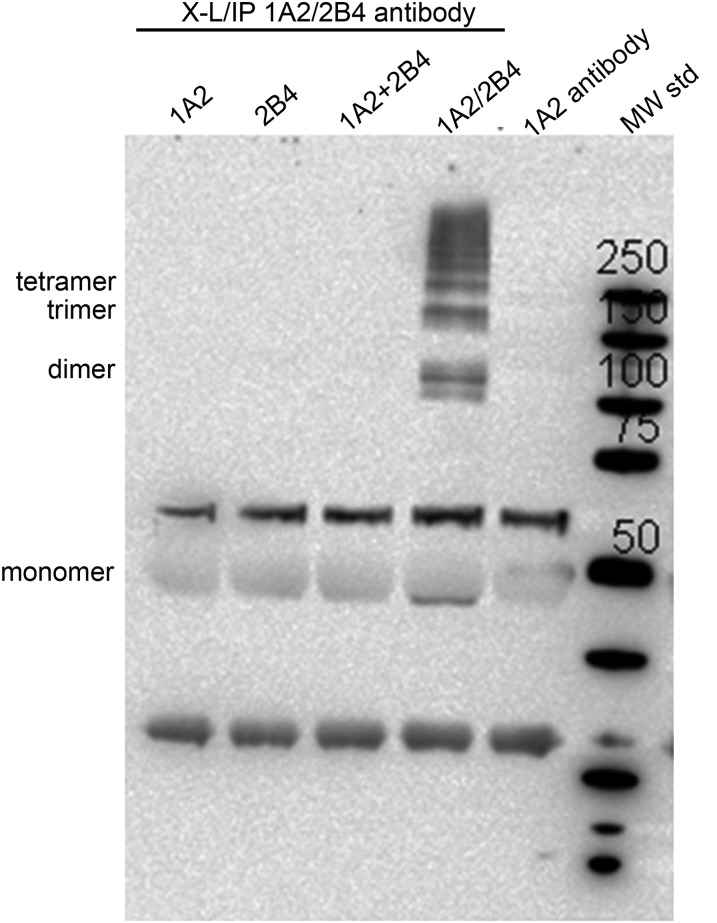
    1. Backes WL, Batie CJ, Cawley GF. (1998) Interactions among P450 enzymes when combined in reconstituted systems: formation of a 2B4-1A2 complex with a high affinity for NADPH-cytochrome P450 reductase. Biochemistry 37:12852–12859 - PubMed
    1. Bass MB, Paulsen MD, Ornstein RL. (1992) Substrate mobility in a deeply buried active site: analysis of norcamphor bound to cytochrome P-450cam as determined by a 201-psec molecular dynamics simulation. Proteins 13:26–37 - PubMed

Publication types

MeSH terms

Substances