Review
. 2013 Oct 9:7:620.
doi: 10.3389/fnhum.2013.00620.

Cortical plasticity within and across lifetimes: how can development inform us about phenotypic transformations?

Affiliations
Review

Cortical plasticity within and across lifetimes: how can development inform us about phenotypic transformations?

Leah Krubitzer et al. Front Hum Neurosci. .

Abstract

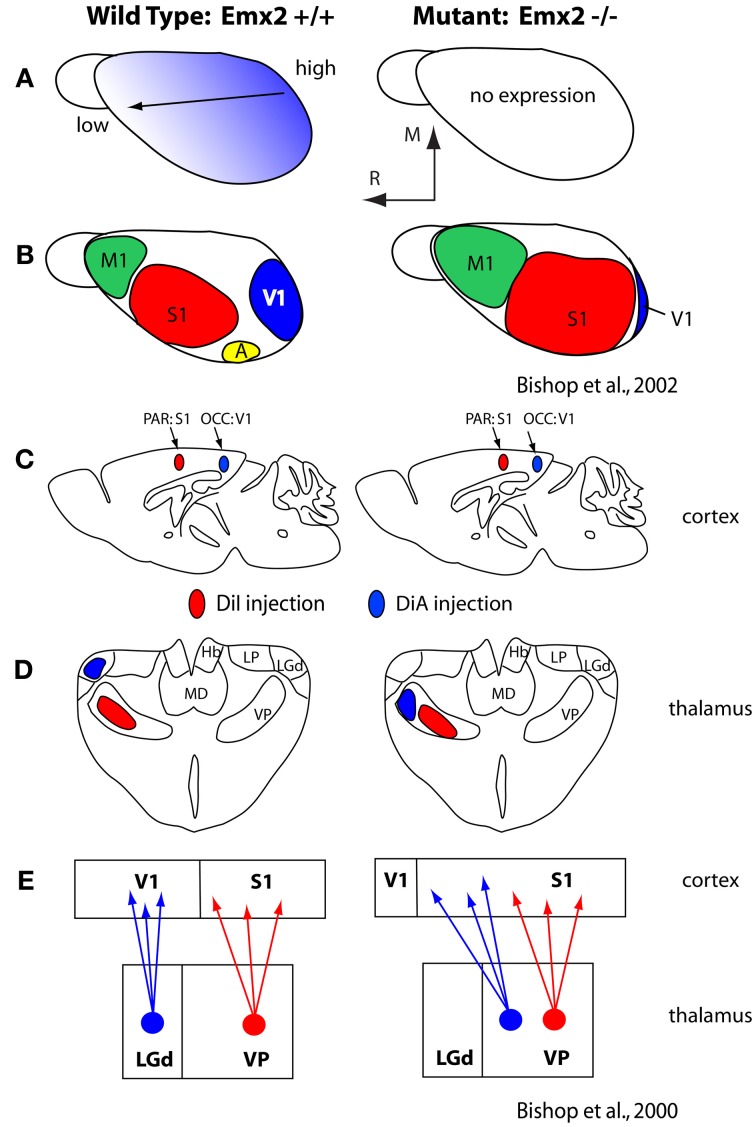
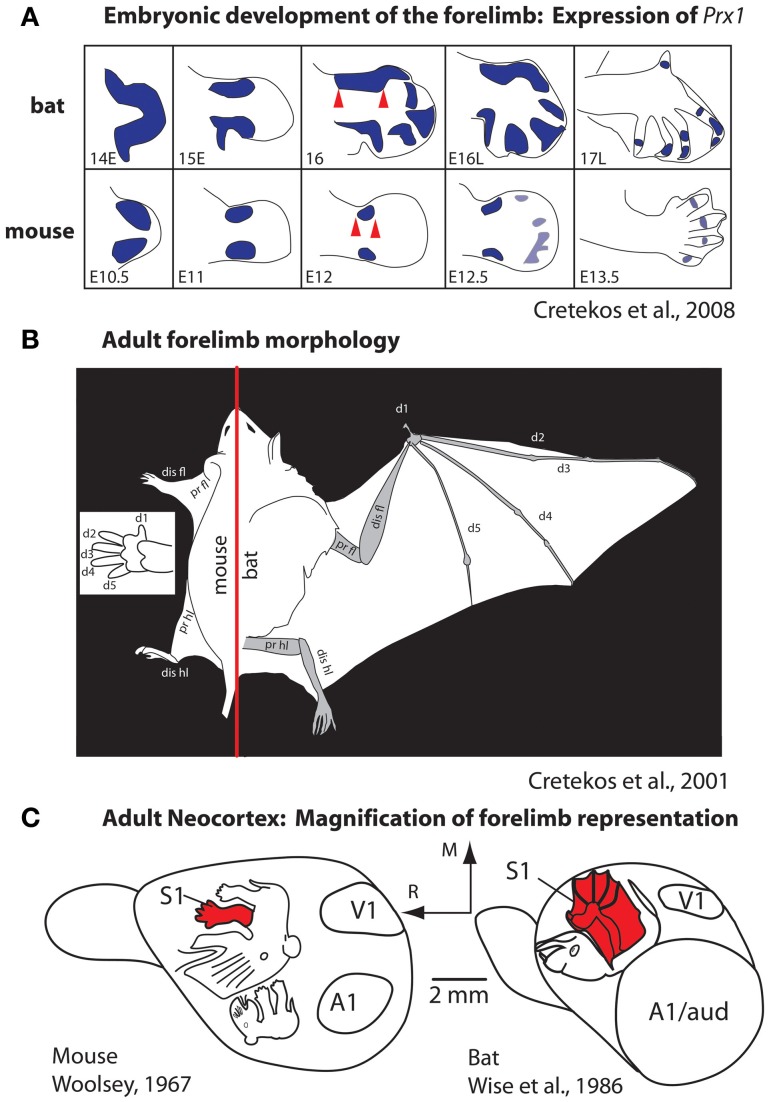
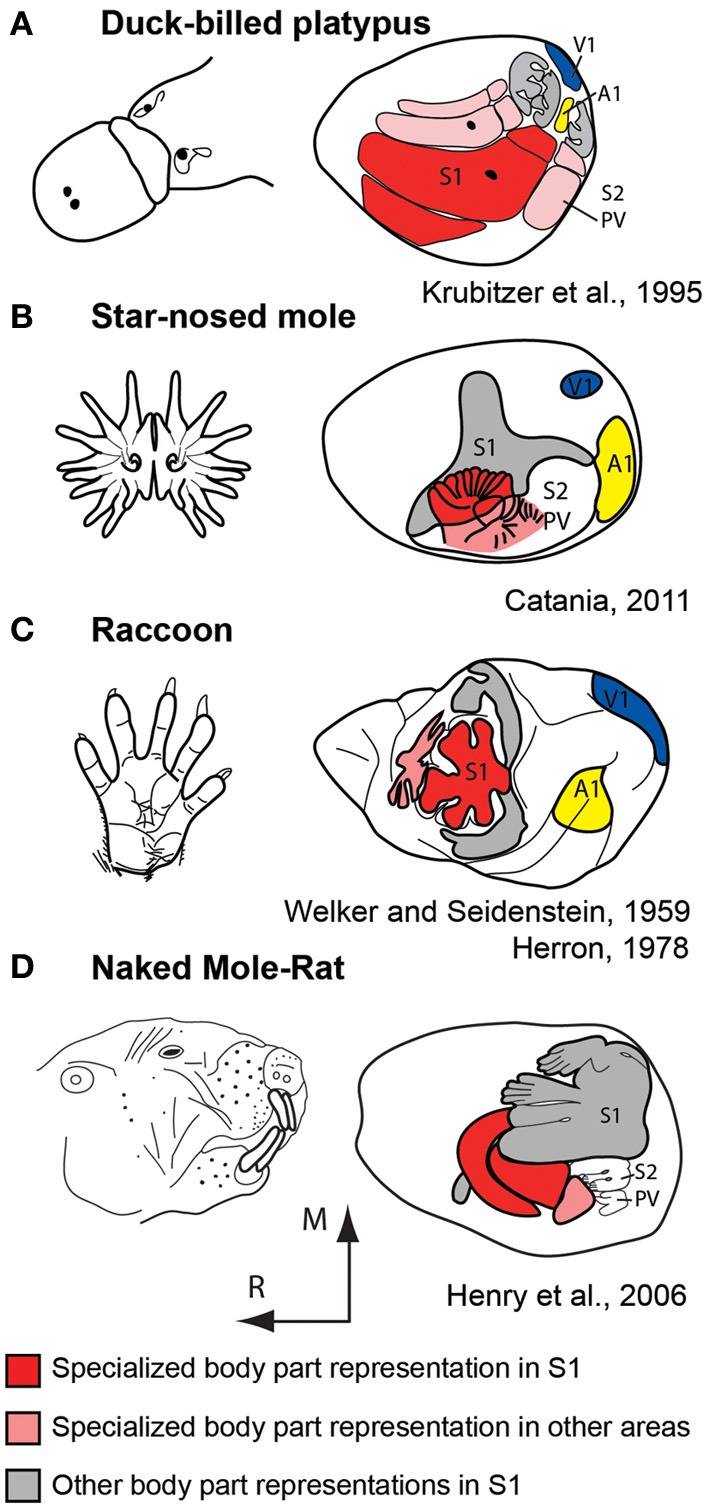
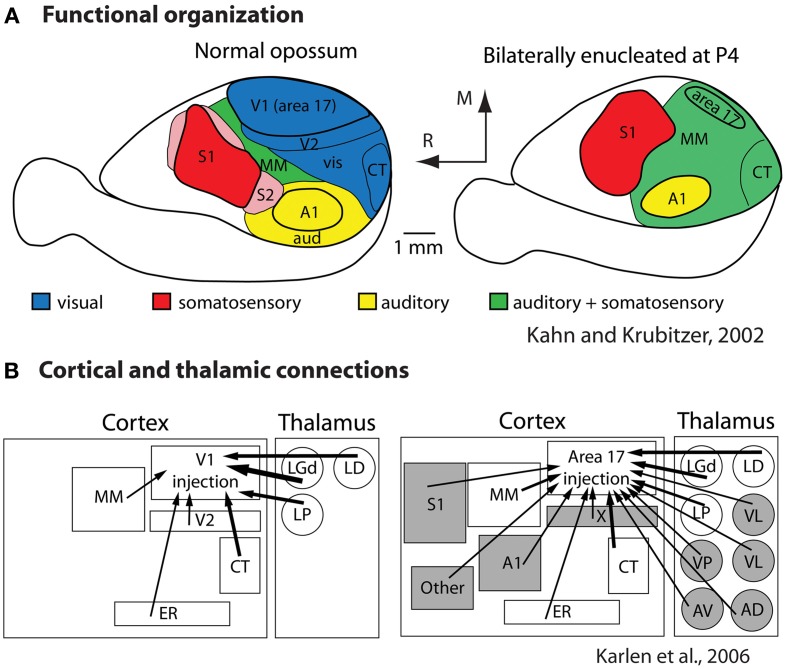
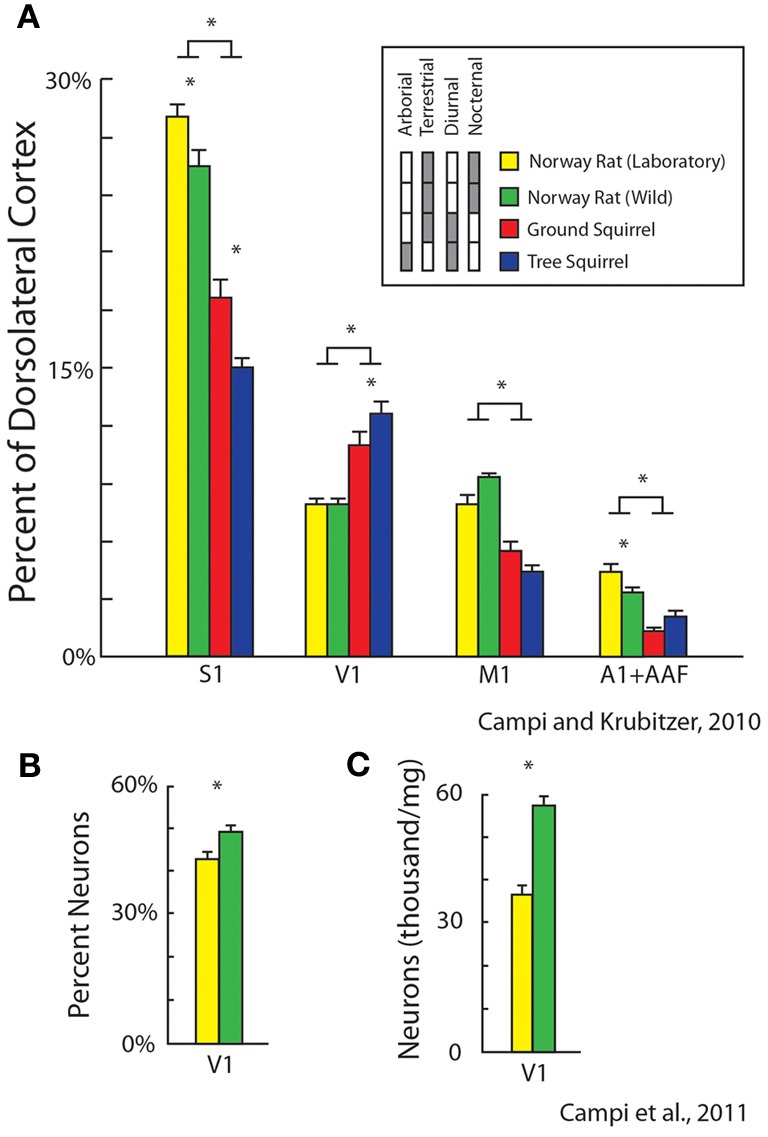
The neocortex is the part of the mammalian brain that is involved in perception, cognition, and volitional motor control. It is a highly dynamic structure that is dramatically altered within the lifetime of an animal and in different lineages throughout the course of evolution. These alterations account for the remarkable variations in behavior that species exhibit. Of particular interest is how these cortical phenotypes change within the lifetime of the individual and eventually evolve in species over time. Because we cannot study the evolution of the neocortex directly we use comparative analysis to appreciate the types of changes that have been made to the neocortex and the similarities that exist across taxa. Developmental studies inform us about how these phenotypic transitions may arise by alterations in developmental cascades or changes in the physical environment in which the brain develops. Both genes and the sensory environment contribute to aspects of the phenotype and similar features, such as the size of a cortical field, can be altered in a variety of ways. Although both genes and the laws of physics place constraints on the evolution of the neocortex, mammals have evolved a number of mechanisms that allow them to loosen these constraints and often alter the course of their own evolution.

Keywords: Evo-Devo; comparative neuroanatomy; cortical development; epigenetic; evolution.


Figures

Figure 1
Figure 1
The organization of the neocortex in the macaque monkey and mouse in cortex that has been peeled from the brainstem and thalamus and flattened. Homologous cortical fields include the primary somatosensory area (S1/3b; red), the second somatosensory area and the parietal ventral area (S2/PV; rose), the primary visual area (V1; dark blue), the second visual area (V2; light blue), the primary auditory area (A1; yellow) and motor cortex (M1; green). While this common plan of organization can be identified in these species, there are also notable differences. Specifically, in macaque monkeys the neocortex has greatly expanded and multiple additional cortical areas have been added. Further, the relative size of homologous cortical fields (as a percentage of overall cortical area) is different. While different investigators have proposed different schemes of cortical organization in the macaque and mouse, it is clear that macaque monkeys have many more cortical fields than does the mouse. Modified from Krubitzer (2009). See Table 1 for abbreviations. All abbreviations for the macaque monkey are not provided; this figure simply demonstrates that the number of cortical fields has increased.
Figure 2
Figure 2
Scaling of the neocortex in different mammals. Comparative studies demonstrate that the neocortex scales linearly or non-linearly. Capybaras can weigh up to 91 kg and have an enlarged brain and neocortex compared to the closely related guinea pig, which weighs 700 g. The more distantly related California ground squirrel has a similar body size to that of the guinea pig, but the scaling of the cortical sheet and cortical fields compared to the capybara is non-linear, and there is an increase in the number of cortical fields. An extreme example of a non-linear increase in the size of the cortical sheet is observed in squirrel monkeys. Although squirrel monkeys are of a similar weight (750 g) compared to the guinea pig and California ground squirrel, they have a relatively large neocortex (about the size of the capybara's), a relative decrease in the size of primary cortical fields (e.g., A1, S1, V1) as a percentage of overall cortical area, and the addition of cortical fields (note that not all known cortical fields in the squirrel monkey neocortex are shown; the blank areas contain additional cortical fields). All brains are drawn to scale. The work on the guinea pig and capybara is modified from Campos and Welker (1976); the divisions of the ground squirrel are redrawn from Krubitzer et al. (2011); divisions of the squirrel monkey are redrawn from Kaas (2012). Other conventions as in previous figure.
Figure 3
Figure 3
Changes in the subventricular zone (SVZ; blue) in vertebrates (top row). Specific alterations in cell cycle kinetics, the overall thickness of the SVZ, the proportion of the SVZ corresponding to the inner and outer layers (ISVZ and OSVZ respectively), and the proportion of asymmetrical radial glial (RG) and outer radial glial (oRG) cell divisions producing intermediate progenitor cells account for expansion of the neocortex in some lineages, such as primates (right half of bottom panel). The SVZ and particularly the OSVZ is larger in primates than in many other species. While mammals with both a large and small neocortex share a number of aspects of neurogenesis (steps 1–5 bottom figure), several additional adaptations are observed in animals with a large neocortex such as primates. This includes increased thickness of particular layers (such as the OSVZ), additional rounds of division for RGs that re-enter the cell cycle in the ventricular zone (VZ) (6), division of oRGs into intermediate progenitor cells (IPC) in the OSVZ (7), which ultimately divide again to produce neurons (8). Whether oRGs also divide to produce IPCs in rodents is still contentious (dotted line on left side, 7). These figures have been modified from Molnár (2011) and Molnár and Molnár and Clowry (2012). Abbreviations in Table 1.
Figure 4
Figure 4
Early in development the position and strength of morphogens, such as FGF8, determines the location and patterning of cortical fields on the cortical sheet. In normal mice (A), FGF8 is expressed early in development in the rostromedial neocortical primordium and forms a rostro-caudal gradient that regulates subsequent rostrocaudal patterns of gene expression. Studies in which Fgf8 is electroporated at differing levels and in different locations in the embryonic mouse (E10.5) demonstrate its importance as an early cortical map organizer. Ectopic placement can result in the duplication of a cortical field (B; S11 and S12) or multiple cortical fields arranged along variant rostro-caudal axes (C). These new duplicated fields are also functionally distinct and form topographic maps, as in normal animals. Modified from Assimacopoulos et al. (2012).
Figure 5
Figure 5
(A) Graded expression of Emx2 in the normal (left) and mutant (right) mice. Normal expression generates normal patterns of cortical fields (B; left) and absence of Emx2 generates altered patterns of organization such that caudal domains have decreased (V1 is small) and rostral domains have expanded into the caudal territories (B; right). (C) Injections into parietal cortex (what will become S1) and occipital cortex (what will become V1) demonstrated altered patterns of thalamocortical connections (D). In mutants what would normally develop into visual cortex has projections from VP, normally associated with somatosensory processing. The schematic in (E) demonstrates normal thalamocortical connections of S1 and V1 (left) and the caudal shift of VP projections into what would normally be visual cortex (E; right). These figures are modified from Bishop et al. (2000, 2002). Conventions as in previous figures.
Figure 6
Figure 6
Development (A) and morphology (B) of the forelimb, and the representation of the forelimb in somatosensory cortex (C) in mice and bats. (A) At middle stages of forelimb development the expression of Prx1 (purple) is expanded in the distal forelimb (red arrows). This alteration, among a number of other molecular changes, accounts for the radical differences in the rat forepaw compared to the bat wing (B). These morphological differences in the distal forelimb in addition to differential use of the paw vs. wing have likely contributed to the differences in size and internal organization of the forelimb representation in S1 (C). Figures are modified from Cretekos et al. (2001, 2008); Woolsey (1967), and Wise et al. (1986). Other conventions as in previous figures.
Figure 7
Figure 7
Examples of extreme cortical magnification of behaviorally relevant effectors for somatosensory cortex of the duck-billed platypus (A), star-nosed mole (B), raccoon (C), and naked mole-rat (D). Although the specialized morphological structure and associated sensory receptor arrays are on different body parts, the same principle of magnification in the neocortex is observed. These figures are modified from Krubitzer et al. (1995) (A); Catania (2011) (B); Welker and Seidenstein (1959) and Herron (1978) (C); Henry et al. (2006) (D). Conventions as in previous figures.
Figure 8
Figure 8
Alterations in the functional organization (A) and connectivity (B) in bilaterally enucleated opossums. In normal animals (left) much of cortex is devoted to visual processing. With early and complete loss of vision (right) all of what would normally develop into visual cortex is taken over by the spared sensory systems. This functional reorganization is accompanied by alterations in thalamocortical and corticocortical connections (B). Modified from Kahn and Krubitzer (2002) (A); Karlen et al. (2006) (B). Conventions as in previous figures.
Figure 9
Figure 9
Alterations in the relative size of primary cortical areas (A) and cellular composition (B,C) between different populations of rodents. These features of organization are related to lifestyle (diurnal vs. nocturnal; arboreal vs. terrestrial) and rearing condition (laboratory, yellow vs. wild-caught, green). Bars represent mean ± standard error, asterisks represent statistical significance. Modified from Campi and Krubitzer (2010) (A); Campi et al. (2011) (B,C).

Similar articles

Cited by

References

    1. Andrews G. L., Mastick G. S. (2003). R-cadherin is a Pax6-regulated, growth-promoting cue for pioneer axons. J. Neurosci. 23, 9873–9880 - PMC - PubMed
    1. Assimacopoulos S., Kao T., Issa N. P., Grove E. A. (2012). Fibroblast growth factor 8 organizes the neocortical area map and regulates sensory map topography. J. Neurosci. 32, 7191–7201 10.1523/JNEUROSCI.0071-12.2012 - DOI - PMC - PubMed
    1. Behringer R. R., Rasweiler J. J., 4th., Chen C.-H., Cretekos C. J. (2009). Genetic regulation of mammalian diversity. Cold Spring Harb. Symp. Quant. Biol. 74, 297–302 10.1101/sqb.2009.74.035 - DOI - PMC - PubMed
    1. Bishop K. M., Goudreau G., O'Leary D. D. (2000). Regulation of area identity in the mammalian neocortex by Emx2 and Pax6. Science 288, 344–349 10.1126/science.288.5464.344 - DOI - PubMed
    1. Bishop K. M., John L. R. R., O'Leary D. D. M. (2002). Distinct actions of Emx1, Emx2, and Pax6 in regulating the specification of areas in the developing neocortex. J. Neurosci. 22, 7627–7638 - PMC - PubMed