

Long-Range Temporal Correlations, Multifractality, and the Causal Relation between Neural Inputs and Movements
- PMID: 24130549
- PMCID: PMC3793199
- DOI: 10.3389/fneur.2013.00158
Long-Range Temporal Correlations, Multifractality, and the Causal Relation between Neural Inputs and Movements
Abstract
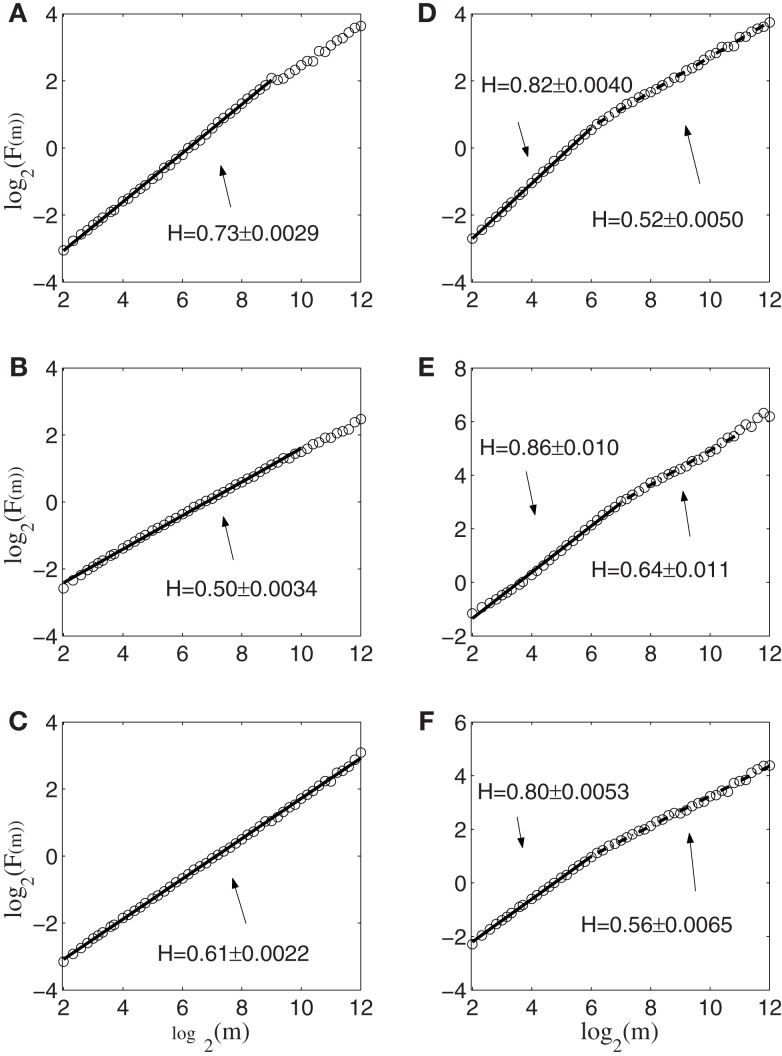
Understanding the causal relation between neural inputs and movements is very important for the success of brain-machine interfaces (BMIs). In this study, we analyze 104 neurons' firings using statistical, information theoretic, and fractal analysis. The latter include Fano factor analysis, multifractal adaptive fractal analysis (MF-AFA), and wavelet multifractal analysis. We find neuronal firings are highly non-stationary, and Fano factor analysis always indicates long-range correlations in neuronal firings, irrespective of whether those firings are correlated with movement trajectory or not, and thus does not reveal any actual correlations between neural inputs and movements. On the other hand, MF-AFA and wavelet multifractal analysis clearly indicate that when neuronal firings are not well correlated with movement trajectory, they do not have or only have weak temporal correlations. When neuronal firings are well correlated with movements, they are characterized by very strong temporal correlations, up to a time scale comparable to the average time between two successive reaching tasks. This suggests that neurons well correlated with hand trajectory experienced a "re-setting" effect at the start of each reaching task, in the sense that within the movement correlated neurons the spike trains' long-range dependences persisted about the length of time the monkey used to switch between task executions. A new task execution re-sets their activity, making them only weakly correlated with their prior activities on longer time scales. We further discuss the significance of the coalition of those important neurons in executing cortical control of prostheses.
Keywords: Fano factor; adaptive fluctuation analysis; brain-machine interface; neuronal firings; wavelet.
Figures


Similar articles
-
Distinguishing cognitive state with multifractal complexity of hippocampal interspike interval sequences.Front Syst Neurosci. 2015 Sep 17;9:130. doi: 10.3389/fnsys.2015.00130. eCollection 2015. Front Syst Neurosci. 2015. PMID: 26441562 Free PMC article.
-
Multifractal Dynamics in Executive Control When Adapting to Concurrent Motor Tasks.Front Physiol. 2021 Apr 16;12:662076. doi: 10.3389/fphys.2021.662076. eCollection 2021. Front Physiol. 2021. PMID: 33935808 Free PMC article.
-
Self-similarity and multifractality in human brain activity: A wavelet-based analysis of scale-free brain dynamics.J Neurosci Methods. 2018 Nov 1;309:175-187. doi: 10.1016/j.jneumeth.2018.09.010. Epub 2018 Sep 10. J Neurosci Methods. 2018. PMID: 30213548
-
Roles of primate spinal interneurons in preparation and execution of voluntary hand movement.Brain Res Brain Res Rev. 2002 Oct;40(1-3):53-65. doi: 10.1016/s0165-0173(02)00188-1. Brain Res Brain Res Rev. 2002. PMID: 12589906 Review.
-
Parieto-frontal coding of reaching: an integrated framework.Exp Brain Res. 1999 Dec;129(3):325-46. doi: 10.1007/s002210050902. Exp Brain Res. 1999. PMID: 10591906 Review.
Cited by
-
Addressing skepticism of the critical brain hypothesis.Front Comput Neurosci. 2022 Sep 15;16:703865. doi: 10.3389/fncom.2022.703865. eCollection 2022. Front Comput Neurosci. 2022. PMID: 36185712 Free PMC article. Review.
-
Dynamics of Long-Range Temporal Correlations in Broadband EEG During Different Motor Execution and Imagery Tasks.Front Neurosci. 2021 May 28;15:660032. doi: 10.3389/fnins.2021.660032. eCollection 2021. Front Neurosci. 2021. PMID: 34121989 Free PMC article.
-
Multifractal analysis of information processing in hippocampal neural ensembles during working memory under Δ⁹-tetrahydrocannabinol administration.J Neurosci Methods. 2015 Apr 15;244:136-53. doi: 10.1016/j.jneumeth.2014.07.013. Epub 2014 Jul 30. J Neurosci Methods. 2015. PMID: 25086297 Free PMC article.
-
Modeling the Ongoing Dynamics of Short and Long-Range Temporal Correlations in Broadband EEG During Movement.Front Syst Neurosci. 2019 Nov 8;13:66. doi: 10.3389/fnsys.2019.00066. eCollection 2019. Front Syst Neurosci. 2019. PMID: 31787885 Free PMC article.
-
The absence of Neuroligin-1 shapes wake/sleep architecture, rhythmic and arrhythmic activities of the electrocorticogram in female mice.Mol Brain. 2025 Apr 23;18(1):38. doi: 10.1186/s13041-025-01186-x. Mol Brain. 2025. PMID: 40269933 Free PMC article.
References
LinkOut - more resources
Full Text Sources
Other Literature Sources