. 2013 Oct 10;8(10):e77125.
doi: 10.1371/journal.pone.0077125. eCollection 2013.

Combined genetic and telemetry data reveal high rates of gene flow, migration, and long-distance dispersal potential in Arctic ringed seals (Pusa hispida)

Affiliations

Combined genetic and telemetry data reveal high rates of gene flow, migration, and long-distance dispersal potential in Arctic ringed seals (Pusa hispida)

Micaela E Martinez-Bakker et al. PLoS One. .

Abstract

Ringed seals (Pusa hispida) are broadly distributed in seasonally ice covered seas, and their survival and reproductive success is intricately linked to sea ice and snow. Climatic warming is diminishing Arctic snow and sea ice and threatens to endanger ringed seals in the foreseeable future. We investigated the population structure and connectedness within and among three subspecies: Arctic (P. hispida hispida), Baltic (P. hispida botnica), and Lake Saimaa (P. hispida saimensis) ringed seals to assess their capacity to respond to rapid environmental changes. We consider (a) the geographical scale of migration, (b) use of sea ice, and (c) the amount of gene flow between subspecies. Seasonal movements and use of sea ice were determined for 27 seals tracked via satellite telemetry. Additionally, population genetic analyses were conducted using 354 seals representative of each subspecies and 11 breeding sites. Genetic analyses included sequences from two mitochondrial regions and genotypes of 9 microsatellite loci. We found that ringed seals disperse on a pan-Arctic scale and both males and females may migrate long distances during the summer months when sea ice extent is minimal. Gene flow among Arctic breeding sites and between the Arctic and the Baltic Sea subspecies was high; these two subspecies are interconnected as are breeding sites within the Arctic subspecies.


Conflict of interest statement

Competing Interests: The authors have declared that no competing interests exist.

Figures

Figure 1
Figure 1. Seasonal localization of ringed seals.
The monthly localization of 27 ringed seals measured as the distance from their breeding/capture site. Note, the log10 scale of the y-axis. Data are uniquely colored for each seal and a smoothing spline was fit for each individual for which we had at least four months of data. Nine adults were found >400 km from their breeding site between the months of the April and November. In the winter months of December-March, individuals were located within 100 km of their breeding location.
Figure 2
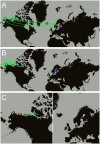
Figure 2. An example of ringed seal migration, sample sites for genetic analysis, and geographic differences in haulout behavior.
(A) The black diamonds are the 9 Arctic breeding sites included in our genetic analysis. Red and green circles connected by arrows are movement of an adult male seal tracked using satellite telemetry from May 2005 to May 2006. The red circle indicates his breeding site where he remained during the “ice-bound” season when the sea ice extended from the North Pole southward to the oceanic areas colored white. The green circles are locations to which he travelled during the “open water” season when the sea ice had retreated north to the region shaded grey. From May - July 2005 he was at his breeding site. He then took a summer trip east (blue arrows) and was located in the Canadian Beaufort in August before returning to his breeding site in October. Upon returning to his breeding site, he embarked upon an autumn trip (orange arrows) west where he was located in November. In May 2006, he was once again located in Barrow. Note, the relative sizes of the circles indicate the number of observations in each region. The breeding sites are in order from west to east: (1) Kotzebue, (2) Peard Bay, (3) Barrow, (4) Oliktok, (5) Prudhoe Bay, and (6) Kaktovik, Alaska; (7) Paktoa, (8) Tuktoyaktuk, and (9) Ulukhaktok/Holman, Canada. (B) The black diamonds numbered 10–11 are the sampling locations in the Baltic Sea and Lake Saimaa, Finland, respectively. (C) Haulout time series and rose diagram of 24-hour haulout cycles for 4 adult seals captured in Peard Bay, Alaska. Haulout time is the percent of the hour the seal was hauled-out atop the sea ice. The dark blue time series is the mean hourly haulout time and the region shaded light blue is the range. The dashed blue lines above the time series indicate the hours from 20∶00 GMT to 08∶00 GMT. Each stacked bar on the rose diagram is the proportion of observations for which a seal was hauled out longer than the mid-range for the day. Each slice represents one of 24 hours of the day, and the lightest bar within a slice is the data for the seal that hauled out the least during that hour; whereas, the darker bars represent seals that hauled out longer during that hour. (D) Haulout time series and rose-diagram for three seals in Paktoa.
Figure 3
Figure 3. COI haplotype frequencies in 7 populations.
The populations are arranged from left to right as follows: Kotzebue (n = 6), Peard Bay (n = 17), Paktoa (n = 14), Tuktoyaktuk (n = 27), Ulukhaktok/Holman (n = 15), Baltic Sea (n = 11), and Lake Saimaa (n = 22). Oliktok was excluded from this figure because we only had one sample from there. Each of the 31 haplotypes is represented by a different color. Lake Saimaa has low haplotype diversity with all but one individual sharing the same haplotype. The Baltic Sea, Ulukhaktok/Holman, Tuktoyaktuk, Paktoa, and Peard Bay all had two prevalent haplotypes (represented by the orange bar and golden bar). Whereas, the haplotypes found in Kotzebue were absent or at low frequency in the other Arctic sites, possibly as an artifact of the low sample size in Kotzebue.
Figure 4
Figure 4. Measures of nuclear genetic variation in Arctic, Baltic, and Saimaa ringed seals.
Breeding sites are coded as purple for Arctic ringed seals; maroon for Baltic ringed seals, and black for Saimaa ringed seals. (A) Relationship between allelic richness (Â) and the number of genotypes in a sample ± SD based on 1000 subsampling replicates. Lake Saimaa has low allelic diversity relative to the other subspecies and the Baltic has moderate diversity. (B) Cross sectional data from the standardized allelic richness curve using a sample size of 20 (ÂN = 20). Breeding sites are organized along the x-axis from west to east. Allelic richness is lowest in Lake Saimaa and the Baltic. Within Arctic ringed seals, allelic richness is depressed in the Western Beaufort populations. Inset: allelic richness curves for Arctic ringed seals in the Chukchi Sea region (C), Western Beaufort (WB), and Eastern Beaufort (EB). Even when the genetic variation is pooled for the entire region, it is lower in the Western Beaufort relative to the Chukchi and the Eastern Beaufort. (C) Observed and expected heterozygosity within breeding sites. Box-and-whisker plots represent the observed heterozygosity across polymorphic microsatellite loci with the median represented by the horizontal line. Circles indicate the mean observed heterozygosity across loci and triangles represent the mean expected heterozygosity. The fractions at the top of the plot are the number of polymorphic loci for which the expected and observed heterozygosity are significantly different (p-value <0.05). Despite relatively low allelic richness, the Baltic had relatively high observed and expected heterozygosity, unlike Lake Saimaa, which had both reduced allelic richness and heterozygosity. Note, Ulukhaktok/Holman is denoted as Holman.
Figure 5
Figure 5. Population differentiation based of nuclear microsatellites: pairwise differences among populations and pairwise FST.
(A) Pairwise FST (below diagonal), average number of pairwise differences within populations (diagonal), and average number of pairwise differences between populations (above diagonal). Color intensity indicates the relative magnitude of the values. (B) Pairwise fixation indices (FST) between subspecies and among breeding populations of Arctic ringed seals. Populations are arranged across the x-axis from west to east. Blue, maroon, and green circles are mean pairwise FST ± SE values between the population labeled and the other 8 Arctic populations. The blue, maroon, and green diamonds represent the mean pairwise FST between the Baltic subspecies and the Chukchi Sea populations, Western Beaufort populations, and the Eastern Beaufort populations of the Arctic subspecies, respectively. The light blue circle is the mean FST taken pairwise between the Lake Saimaa and Baltic subspecies along with each pairwise FST between Lake Saimaa ringed seals and the nine Arctic breeding sites. The labels near each point represent the fraction of pairwise comparisons for which the pairwise FST was significantly different from zero (p-value <0.05). The Baltic is more similar to all the Eastern Beaufort breeding sites than several of the Arctic sites are to each other. Although the Baltic and Eastern Beaufort we not highly divergent, the mean FST for the Baltic and the Western Beaufort can be interpreted as moderate differentiation. Lake Saimaa ringed seals are genetically highly divergent from the other seal populations. Note, Ulukhaktok/Holman is denoted as Holman.
Figure 6
Figure 6. Panmixia and genetic differentiation between subspecies and breeding populations of ringed seals.
Breeding sites from left-to-right: Kotzebue, Peard Bay, Paktoa, Tuktoyaktuk, Ulukhaktok/Holman, Baltic Sea, and Lake Saimaa. Populations with the same color and connected by a line were deemed panmictic based on pairwise permutation tests using (A) mtDNA Cytochrome Oxidase I, (B) mtDNA control region, and (C) microsatellites. Non-panmictic sites are significantly differentiated from other sites (p-values <0.05). Breeding sites left-to-right in panel C: Kotzebue, Peard Bay, Barrow, Oliktok, Prudhoe, Kaktovik, Paktoa, Tuktoyaktuk, Ulukhaktok/Holman, Baltic Sea, and Lake Saimaa.
Figure 7
Figure 7. Maximum likelihood parameter estimates of mutation-rate-scaled effective population sizes and migration rates.
(A) Mutation-scaled effective population size (Θ) estimates based on mtDNA. Each circle represents a ringed seal subspecies and the relative size of the circle is indicative of the effective population size. Arrows are labeled with the estimated number of migrants per generation. (B) Estimates based on nuclear microsatellites.

References

    1. Moore SE, Huntington HP (2008) Arctic marine mammals and climate change: impacts and resilience. Ecological Applications 18: s157–165. - PubMed
    1. Post E, Forchhammer MC, Bret-Harte MS, Callaghan TV, Christensen TR, et al. (2009) Ecological dynamics across the Arctic associated with recent climate change. Science 325: 1355–1358. - PubMed
    1. Monnett C, Gleason JS (2006) Observations of mortality associated with extended open-water swimming by polar bears in the Alaskan Beaufort Sea. Polar Biology 29: 681–687.
    1. United States Fish and Wildlife Service (2008) Endangered and threatened wildlife and plants; determination of threatened status for the polar bear (Ursus maritimus) throughout its range.
    1. Ferguson S, Stirling I, McLoughlin P (2005) Climate Change and ringed seal (Phoca hispida) recruitment in Western Hudson Bay. Marine Mammal Science 21: 121–135.

Publication types