. 2013 Oct 10;8(10):e77263.
doi: 10.1371/journal.pone.0077263. eCollection 2013.

Non-specific dsRNA-mediated antiviral response in the honey bee

Affiliations

Non-specific dsRNA-mediated antiviral response in the honey bee

Michelle L Flenniken et al. PLoS One. .

Abstract

Honey bees are essential pollinators of numerous agricultural crops. Since 2006, honey bee populations have suffered considerable annual losses that are partially attributed to Colony Collapse Disorder (CCD). CCD is an unexplained phenomenon that correlates with elevated incidence of pathogens, including RNA viruses. Honey bees are eusocial insects that live in colonies of genetically related individuals that work in concert to gather and store nutrients. Their social organization provides numerous benefits, but also facilitates pathogen transmission between individuals. To investigate honey bee antiviral defense mechanisms, we developed an RNA virus infection model and discovered that administration of dsRNA, regardless of sequence, reduced virus infection. Our results suggest that dsRNA, a viral pathogen associated molecular pattern (PAMP), triggers an antiviral response that controls virus infection in honey bees.


Conflict of interest statement

Competing Interests: This study was partly funded by a Honey Bee Biology Postdoctoral Fellowship co-sponsored in part by Häagen Dazs. This does not alter the authors' adherence to all the PLOS ONE policies on sharing data and materials.

Figures

Figure 1
Figure 1. Honey bees are productively infected with a model virus, SINV-GFP.
(A) Honey bees were infected with SINV-GFP and fluorescence microscopy revealed increased amounts of GFP each day post-injection (d.p.i.) (GFP pixel counts quantified using ImageJ in lower right corner of each image) and represented graphically in (B). (C) SINV-GFP was detected in honey bee protein lysates from the injection site, thorax (Th), and distal sites (D; head and abdomen) each d.p.i. by Western blot analysis using α-GFP (green lower arrow) and a-actin (top arrow) antibodies. Western blot bands were quantified using ImageJ and the GFP:actin ratio was normalized to 1* at day 2 p.i..
Figure 2
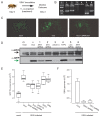
Figure 2. dsRNA-mediated reduction of virus in honey bees.
(A) Schematic of experiment. Honey bees were inoculated with SINV-GFP or co-injected with (B) nucleic acid treatments including: virus-specific dsRNA (SINV dsRNA); non-specific dsRNA corresponding to Drosophila C virus (DCV) sequence (DCV dsRNA); poly(I:C); NTPs; non-specific dsRNA corresponding to luciferase sequence (LUC dsRNA); or SINV dsDNA visualized on a 1% agarose gel. (C) Fluorescence microscope images of a mock-infected bee (left panel), a SINV-GFP infected bee (middle panel), or a bee infected with SINV-GFP in the presence of non-specific dsRNA DCV. (D) Western blot analysis using α-GFP and α-actin antibodies demonstrated reduced SINV-GFP in bee protein lysates pooled from ten bees treated with dsRNA (lanes 1, 2, and 5) and poly(I:C) (lane 3), but not in bees treated with NTPs (lane 4) or dsDNA (lane 6) compared to bees inoculated with virus alone (virus). Mock-infected (mock) bees injected with buffer had no detectable GFP. (E) Boxplot of GFP fluorescence (510 nm, relative arbitrary units) in individual honey bee lysates (10 bees per condition). A Welch two-sample t-test was performed to compare honey bee lysates from each treatment group to virus-infected bees and determined statistically significant differences between bees co-inoculated with virus-specific dsRNA SINV p=0.023, with non-specific dsRNA DCV p=0.020, and with poly(I:C) p=0.0038, whereas co-injection of NTPs p=0.41 or dsDNA p=0.36 were not significantly different from virus alone (virus). Bees injected with virus only (virus) exhibited greater fluorescence compared to mock-infected controls (m); p=0.00001. (F) Relative abundance of SINV-GFP in individual bees (5 per condition) from different treatment groups was assessed by RT-qPCR. The bees treated with virus only had the highest SINV copy number 3 days p.i. (1.65x10⁶ copies + 4,100 copies per 500 ng RNA, ~1.65x10⁸ per bee), as compared to those in which either virus-specific SINV dsRNA (1.66x10⁵ +1,050) or non-specific DCV dsRNA (2.32x10⁵ + 1,070) was co-injected with virus.
Figure 3
Figure 3. Differentially expressed honey bee genes.
(A) Table of differentially expressed genes (DEGs) in virus-infected or dsRNA-treated bees as compared to mock-infected bees (adj. p-value < 0.05); the number of genes with increased (up) and decreased (down) expression are listed below each condition. (B) Venn diagram illustrating the degree of similarity and uniqueness of DEGs (adj. p-value < 0.5) between virus-infected (virus) and dsRNA-treated bees (dsRNA).
Figure 4
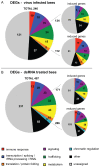
Figure 4. Gene Ontology analysis demonstrated reduced expression of immune genes and perturbation of cell-signaling, trafficking, and metabolism.
Differentially expressed genes (DEGs, adj. p-value < 0.05) in (A) virus-infected or (B) dsRNA-treated honey bees as compared to mock-infected bees were assigned gene ontology terms for biological process, molecular function, and cellular compartment (see Tables S3-4). Biological process assignments were further categorized into seven functional groups: immune response (red); transcription, splicing, rRNA processing and RNAi (blue); signaling (purple); trafficking (green); metabolism (yellow); translation and protein folding (orange); and chromatin regulation (teal). A small fraction of the DEGs (10-15%) belonged to other biological process gene ontologies (black) and a large fraction was not assigned (gray). Each pie chart represents 100% of the DEGs and gene numbers are reported in each section. *Each oligonucleotide pair was analyzed as a single gene and since multiple microarray probes corresponded to apidaecin variants the majority of annotated immune effectors in this Figure (7 of 10 in virus-infected bees and 8 of 12 in dsRNA) correspond with apidaecin 1.
Figure 5
Figure 5. Quantitative PCR validation of a subset of DEGs.
Quantitative PCR (qPCR) was used to validate honey bee gene expression microarray results. (A) apidaecin 1 expression in virus-infected bees was 20% + 6 of mock-infected controls (112% + 30%) and dsRNA-treatment also reduced expression to 15% + 3% of mock-infected controls; t-test p=0.01 and p=0.01 respectively. (B) unc-80 expression in virus-infected bees (126% + 9%) was higher than mock-infected controls (101% + 4%) (p=0.046). (C) lethal (3) expression increased in response to dsRNA-treatment to 156% + 14 relative to its expression in mock-infected bees 101% + 6% (p=0.03. Standard SYBR qPCR was performed for apidaecin 1 gene expression, whereas Taqman probe and primer sets were employed for other assayed genes. qPCR reactions were performed as technical triplicates of five individual bee cDNAs (biological replicates) per condition; the expression of each gene-of-interest (GOI) was compared to the housekeeping gene (Rpl8) and then the expression level of each GOI in five individual bees per experimental condition was calculated as a percentage relative to its expression in individual mock-infected bees using the ΔΔC(t) formula (y-axis), error bars represent +/- standard error of the mean (SEM), and statistical significance was assessed using Student’s t-tests.

References

    1. Vanengelsdorp D, Evans JD, Saegerman C, Mullin C, Haubruge E et al. (2009) Colony Collapse Disorder: A Descriptive Study. PLOS ONE 4: e6481. doi:10.1371/journal.pone.0006481. PubMed: 19649264. - DOI - PMC - PubMed
    1. Evans JD, Schwarz RS (2011) Bees brought to their knees: microbes affecting honey bee health. Trends Microbiol 19: 614–620. doi:10.1016/j.tim.2011.09.003. PubMed: 22032828. - DOI - PubMed
    1. Runckel C, Flenniken ML, Engel JC, Ruby JG, Ganem D, et al. (2011) Temporal analysis of the honey bee microbiome reveals four novel viruses and seasonal prevalence of known viruses, Nosema, and Crithidia, *co-first authors. PLOS ONE 6: e20656. doi:10.1371/journal.pone.0020656. PubMed: 21687739. - DOI - PMC - PubMed
    1. Dainat B, Evans JD, Chen YP, Gauthier L, Neumann P (2012) Predictive markers of honey bee colony collapse. PLOS ONE 7: e32151. doi:10.1371/journal.pone.0032151. PubMed: 22384162. - DOI - PMC - PubMed
    1. Cornman RS, Tarpy DR, Chen Y, Jeffreys L, Lopez D et al. (2012) Pathogen webs in collapsing honey bee colonies. PLOS ONE 7: e43562. doi:10.1371/journal.pone.0043562. PubMed: 22927991. - DOI - PMC - PubMed

Publication types

Substances