. 2013 Oct 16:10:106.
doi: 10.1186/1742-4690-10-106.

Expression profile of host restriction factors in HIV-1 elite controllers

Affiliations

Expression profile of host restriction factors in HIV-1 elite controllers

Mohamed Abdel-Mohsen et al. Retrovirology. .

Abstract

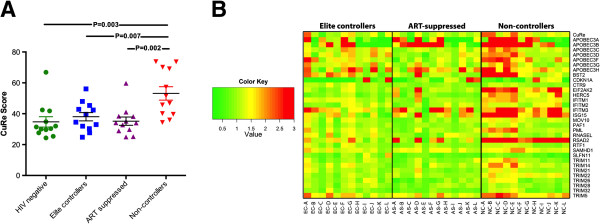
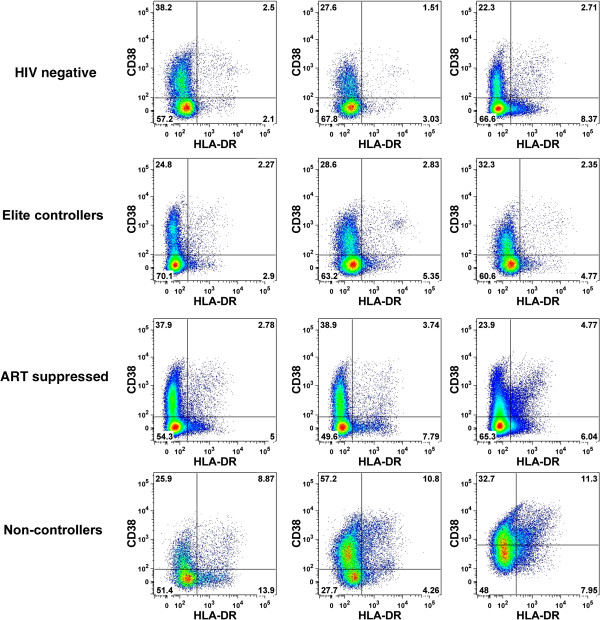
Background: Several host-encoded antiviral factors suppress HIV-1 replication in a cell-autonomous fashion in vitro. The relevance of these defenses to the control of HIV-1 in vivo remains to be elucidated. We hypothesized that cellular restriction of HIV-1 replication plays a significant role in the observed suppression of HIV-1 in "elite controllers", individuals who maintain undetectable levels of viremia in the absence of antiretroviral therapy (ART). We comprehensively compared the expression levels of 34 host restriction factors and cellular activation levels in CD4+ T cells and sorted T cell subsets between elite controllers, HIV-1-infected (untreated) non-controllers, ART-suppressed, and uninfected individuals.

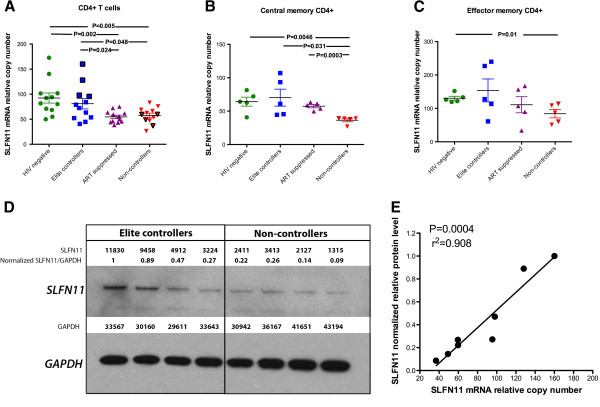
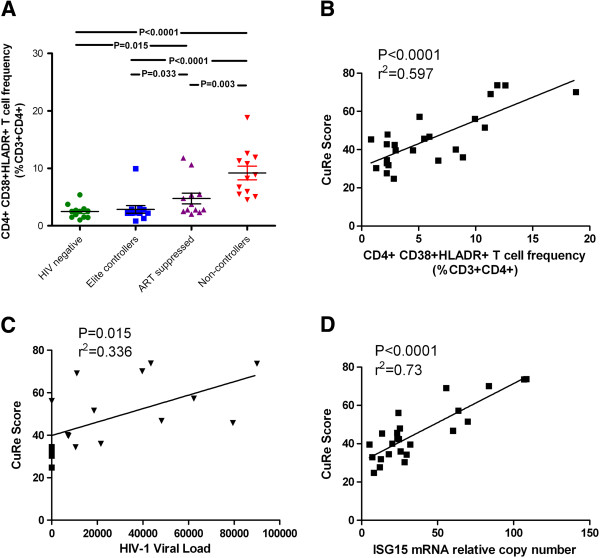
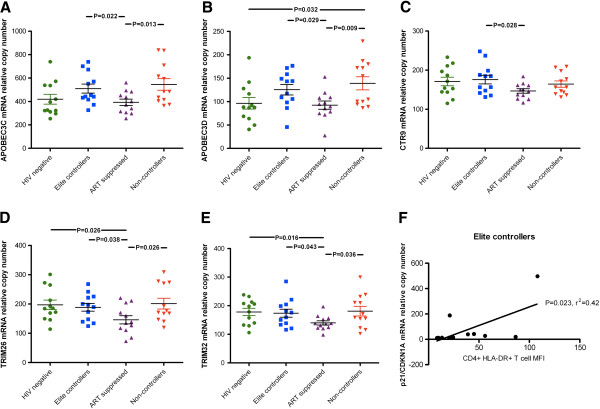
Results: Expression of schlafen 11, a codon usage-based inhibitor of HIV-1 protein synthesis, was significantly elevated in CD4+ T cells from elite controllers as compared to both non-controllers (p = 0.048) and ART-suppressed individuals (p = 0.024), with this effect most apparent in central memory CD4+ T cells. Schlafen 11 expression levels were comparable between controllers and uninfected individuals. Cumulative restriction factor expression was positively correlated with CD4+ T cell activation (r² = 0.597, p < 0.0001), viral load (r² = 0.34, p = 0.015), and expression of ISG15 (r² = 0.73, p < 0.0001), a marker of interferon exposure. APOBEC3C, APOBEC3D, CTR9, TRIM26, and TRIM32 were elevated in elite controllers with respect to ART-suppressed individuals, while levels were comparable to uninfected individuals and non-controllers.

Conclusions: Host restriction factor expression typically scales with cellular activation levels. However, the elevated mRNA and protein expression of schlafen 11, despite low activation and viral load, violates the global pattern and may be a signature characteristic of HIV-1 elite control.


Figures

Figure 1
Figure 1
Relationship between restriction factor expression and HIV-1 disease state. (A) CuRe (Cumulative Restriction) scores across HIV-1 disease states. Reported p-values were obtained using unpaired t tests. (B) Heat map representing expression of individual restriction genes across HIV-1 disease states. Fold-differences of each gene’s expression level in relation to the median values for each gene in the HIV-negative control group are reported. Yellow coloring indicates value of 1 (expression values equivalent to the median of HIV-negative controls). Red coloring indicates elevated relative expression, and green coloring indicates suppressed relative expression. Each column represents a single individual.
Figure 2
Figure 2
Elevated expression of schlafen 11 in HIV-1 elite controllers. (A) schlafen 11 (SLFN11) expression in unfractionated CD4+ T cells across disease states. Data points involved in subsequent protein characterization are highlighted with black bordering. (B) SLFN11 expression in central memory CD4+ T cells. (C) SLFN11 expression in effector memory CD4+ T cells. Reported p-values in panels A-C were obtained using unpaired t tests. (D) SLFN11 protein expression in elite controllers and non-controllers, as determined by western blot. Immunoblotting bands were quantified with ImageJ64 software. The quantified SLFN11 protein expression levels were normalized to corresponding GAPDH protein levels to ensure equal loading. (E) Correlation between SLFN11 normalized protein level and mRNA relative copy number. A Spearman’s rank test was used to evaluate the significance of the correlation.
Figure 3
Figure 3
Frequency of activated CD4+ T cells across HIV-1 disease states. CD38 and HLA-DR expression on the surface of CD4+ T cells was measured by flow cytometry. Plots for three representative, median individuals are included for each HIV-1 disease state. Percentages of activated cells (co-expressing CD38 and HLA-DR) are reported in the upper-right quadrant of each plot.
Figure 4
Figure 4
Immunologic and virologic correlates of host restriction factor expression. (A) Frequency of activated (CD38+ HLA-DR+) CD4+ T cells across disease states. Reported p-values were obtained using unpaired t tests. Correlations between CuRe score and CD4+ T cell activation, HIV-1 viral load, and ISG15 expression in HIV-1-infected, untreated individuals (elite controllers and non-controllers) are reported in (B), (C), and (D), respectively. Correlations were evaluated using Pearson’s r tests.
Figure 5
Figure 5
Elevated expression of restriction factor genes in HIV-1 elite controllers with respect to ART-suppressed individuals. Five restriction factors were significantly elevated in elite controllers with respect to ART-suppressed subjects: (A) APOBEC3C, (B) APOBEC3D, (C) CTR9, (D) TRIM26, and (E) TRIM32. Gene expression between groups was compared using unpaired t tests. (F) The expression of CDKN1A/p21 was positively correlated with CD4+ T cell activation in elite controllers. There were no correlations between gene expression and activation in ART-suppressed individuals. Correlations were evaluated using Pearson’s r tests.

Similar articles

Cited by

References

    1. Volberding PA, Deeks SG. Antiretroviral therapy and management of HIV infection. Lancet. 2010;376:49. doi: 10.1016/S0140-6736(10)60676-9. - DOI - PubMed
    1. Zaunders J, van Bockel D. Innate and adaptive immunity in long-term non-progression in HIV disease. Front Immunol. 2013;4:95. - PMC - PubMed
    1. Saag M, Deeks SG. How do HIV elite controllers do what they do? Clin Infect Dis. 2010;51:239. doi: 10.1086/653678. - DOI - PubMed
    1. Cruz NV, Amorim R, Oliveira FE, Speranza FA, Costa LJ. Mutations in the nef and vif genes associated with progression to AIDS in elite controller and slow-progressor patients. J Med Virol. 2013;85:563. doi: 10.1002/jmv.23512. - DOI - PubMed
    1. Blankson JN, Bailey JR, Thayil S, Yang HC, Lassen K, Lai J, Gandhi SK, Siliciano JD, Williams TM, Siliciano RF. Isolation and characterization of replication-competent human immunodeficiency virus type 1 from a subset of elite suppressors. J Virol. 2007;81:2508. doi: 10.1128/JVI.02165-06. - DOI - PMC - PubMed

Publication types

MeSH terms