

Extended high-frequency thresholds in college students: effects of music player use and other recreational noise
- PMID: 24131608
- PMCID: PMC4111237
- DOI: 10.3766/jaaa.24.8.9
Extended high-frequency thresholds in college students: effects of music player use and other recreational noise
Abstract
Background: Human hearing is sensitive to sounds from as low as 20 Hz to as high as 20,000 Hz in normal ears. However, clinical tests of human hearing rarely include extended high-frequency (EHF) threshold assessments, at frequencies extending beyond 8000 Hz. EHF thresholds have been suggested for use monitoring the earliest effects of noise on the inner ear, although the clinical usefulness of EHF threshold testing is not well established for this purpose.
Purpose: The primary objective of this study was to determine if EHF thresholds in healthy, young adult college students vary as a function of recreational noise exposure.
Research design: A retrospective analysis of a laboratory database was conducted; all participants with both EHF threshold testing and noise history data were included. The potential for "preclinical" EHF deficits was assessed based on the measured thresholds, with the noise surveys used to estimate recreational noise exposure.
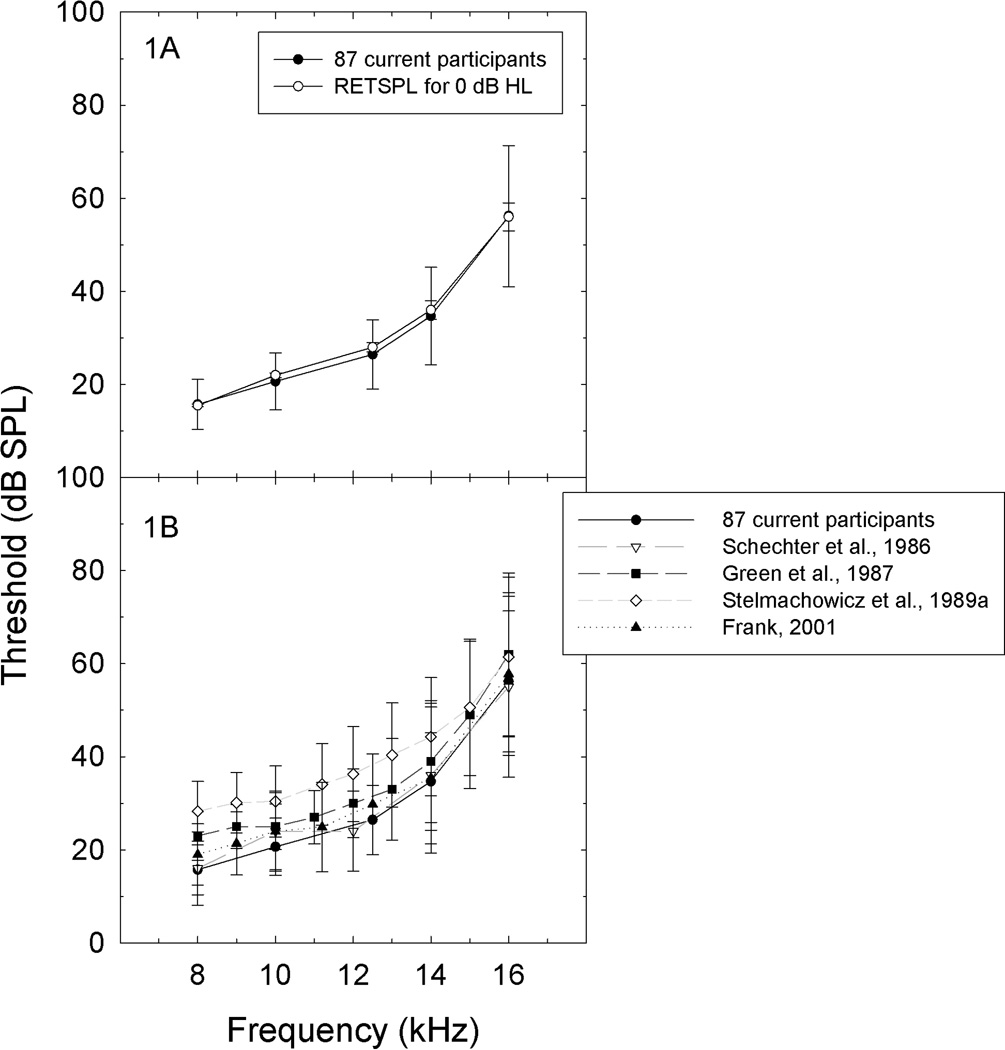
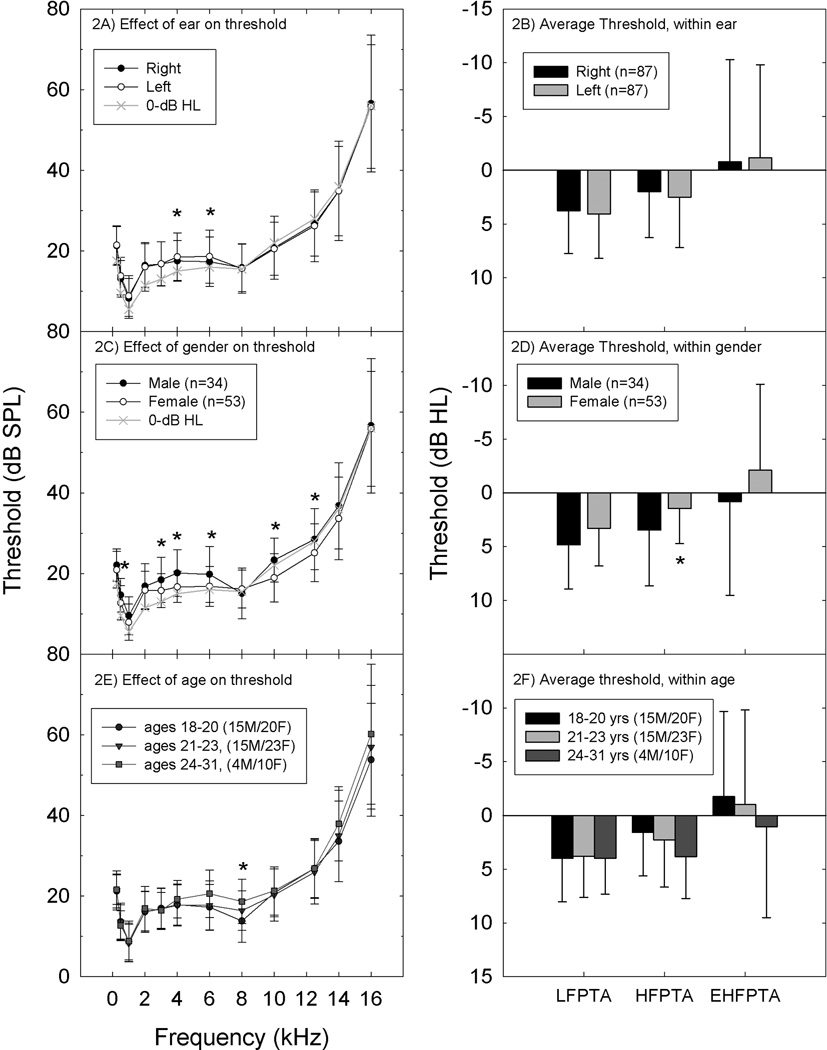
Study sample: EHF thresholds measured during participation in other ongoing studies were available from 87 participants (34 male and 53 female); all participants had hearing within normal clinical limits (≤25 HL) at conventional frequencies (0.25-8 kHz).
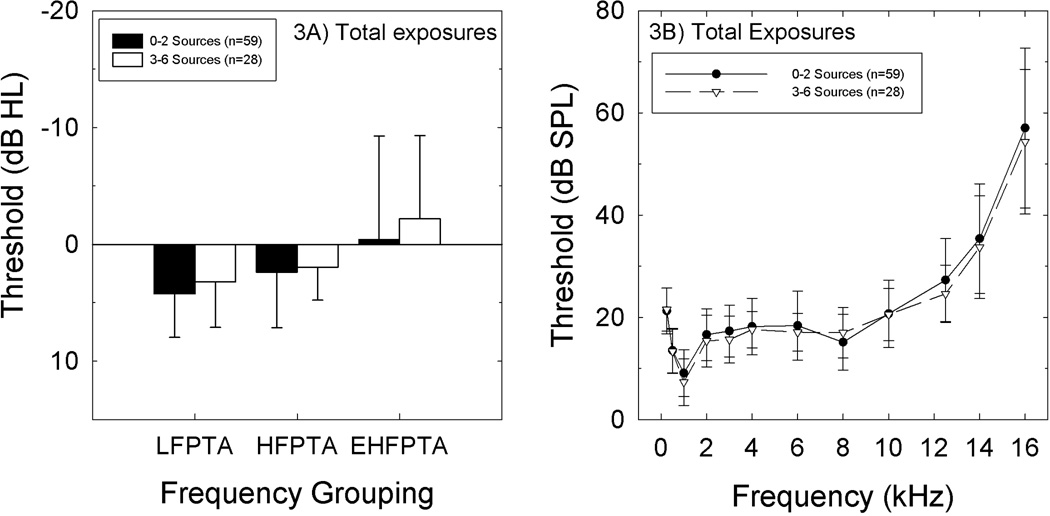
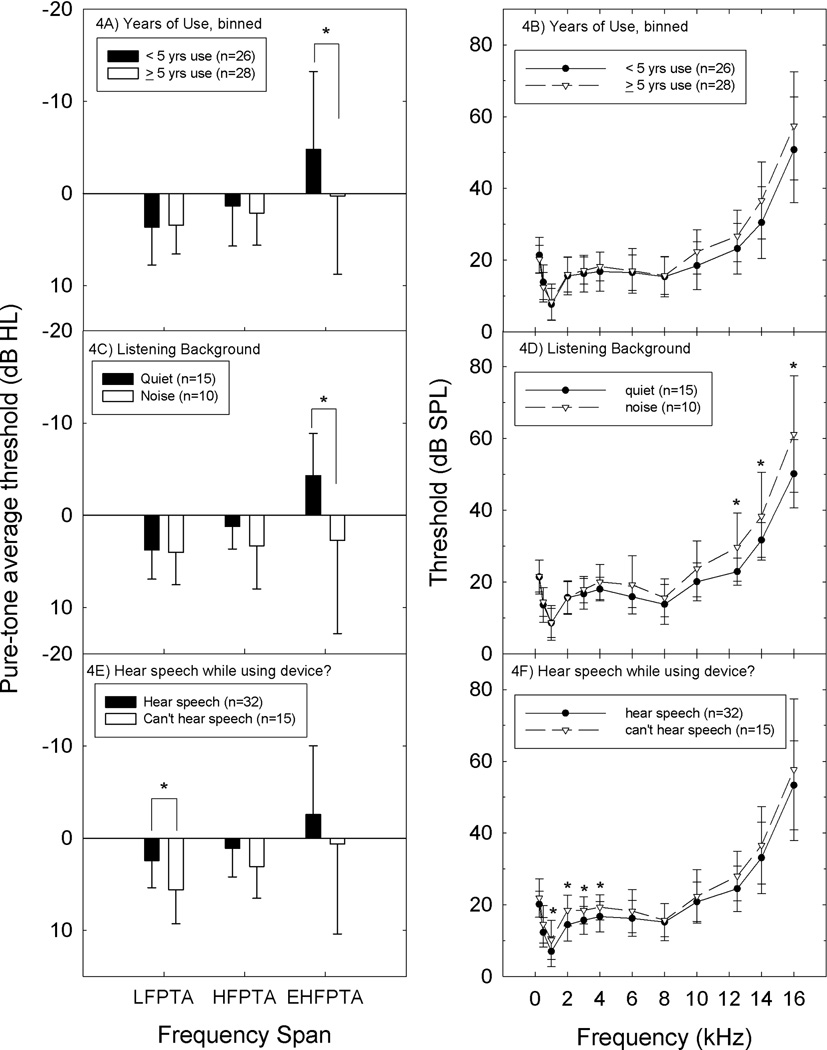
Results: EHF thresholds closely matched standard reference thresholds [ANSI S3.6 (1996) Annex C]. There were statistically reliable threshold differences in participants who used music players, with 3-6 dB worse thresholds at the highest test frequencies (10-16 kHz) in participants who reported long-term use of music player devices (>5 yr), or higher listening levels during music player use.
Conclusions: It should be possible to detect small changes in high-frequency hearing for patients or participants who undergo repeated testing at periodic intervals. However, the increased population-level variability in thresholds at the highest frequencies will make it difficult to identify the presence of small but potentially important deficits in otherwise normal-hearing individuals who do not have previously established baseline data.
American Academy of Audiology.
Figures
Similar articles
-
Extended High-frequency Hearing Impairment Despite a Normal Audiogram: Relation to Early Aging, Speech-in-noise Perception, Cochlear Function, and Routine Earphone Use.Ear Hear. 2022 May/Jun;43(3):822-835. doi: 10.1097/AUD.0000000000001140. Ear Hear. 2022. PMID: 34700326
-
Transient-evoked otoacoustic emissions in a group of professional singers who have normal pure-tone hearing thresholds.Ear Hear. 2008 Jun;29(3):360-77. doi: 10.1097/AUD.0b013e31816a0d1e. Ear Hear. 2008. PMID: 18382377
-
Extended High-Frequency Smartphone Audiometry: Validity and Reliability.J Am Acad Audiol. 2019 Mar;30(3):217-226. doi: 10.3766/jaaa.17111. Epub 2018 Jan 18. J Am Acad Audiol. 2019. PMID: 30461416
-
Extended High-frequency Audiometry in the Elderly: A Narrative Review.J Int Adv Otol. 2024 Jul 29;20(4):358-364. doi: 10.5152/iao.2024.231217. J Int Adv Otol. 2024. PMID: 39162007 Free PMC article. Review.
-
Exposure to Noise or Music in Clinical Trials: A Scoping Review on Ethical and Methodological Considerations.Noise Health. 2024 Jul-Sep 01;26(122):243-251. doi: 10.4103/nah.nah_41_23. Epub 2024 Sep 30. Noise Health. 2024. PMID: 39345060 Free PMC article.
Cited by
-
Temporary threshold shift after impulse-noise during video game play: laboratory data.Int J Audiol. 2014 Mar;53 Suppl 2(0 2):S53-65. doi: 10.3109/14992027.2013.865844. Int J Audiol. 2014. PMID: 24564694 Free PMC article.
-
The Relationship Between Hearing Thresholds and Hyperandrogenism in Polycystic Ovary Syndrome.Med Sci Monit. 2016 Nov 15;22:4380-4385. doi: 10.12659/msm.898670. Med Sci Monit. 2016. PMID: 27846196 Free PMC article.
-
The association of obesity with hearing thresholds in women aged 18-40 years.Endocrine. 2016 Apr;52(1):46-53. doi: 10.1007/s12020-015-0755-y. Epub 2015 Oct 1. Endocrine. 2016. PMID: 26429780
-
Effects of Recreational Noise on Threshold and Suprathreshold Measures of Auditory Function.Semin Hear. 2017 Nov;38(4):298-318. doi: 10.1055/s-0037-1606325. Epub 2017 Oct 10. Semin Hear. 2017. PMID: 29026263 Free PMC article. Review.
-
The Effect of Various Patterns of Personal Listening Devices on Hearing Among University Students in Saudi Arabia.Acta Inform Med. 2022 Sep;30(3):225-229. doi: 10.5455/aim.2022.30.225-229. Acta Inform Med. 2022. PMID: 36311152 Free PMC article.
References
-
- Agrawal Y, Platz EA, Niparko JK. Prevalence of hearing loss and differences by demographic characteristics among US adults: data from the National Health and Nutrition Examination Survey, 1999–2004. Arch Intern Med. 2008;168:1522–1530. - PubMed
-
- Ahmed HO, Dennis JH, Badran O, Ismail M, Ballal SG, Ashoor A, Jerwood D. High-frequency (10–18 kHz) hearing thresholds: reliability, and effects of age and occupational noise exposure. Occup Med (Lond) 2001;51:245–258. - PubMed
-
- American National Standards Institute. American national standard specifications for audiometers, S3.6–1996. American National Standards Institute, New York. 1996
-
- Axelsson A, Lindgren F. Hearing in pop musicians. Acta Otolaryngol (Stockh) 1978;85:225–231. - PubMed
-
- Axelsson A, Eliasson A, Israelsson B. Hearing in pop/rock musicians: a follow-up study. Ear Hear. 1995;16:245–253. - PubMed
Publication types
MeSH terms
Grants and funding
LinkOut - more resources
Full Text Sources
Other Literature Sources
Medical
Miscellaneous