

Using environmental niche models to test the 'everything is everywhere' hypothesis for Badhamia
- PMID: 24132078
- PMCID: PMC3960529
- DOI: 10.1038/ismej.2013.183
Using environmental niche models to test the 'everything is everywhere' hypothesis for Badhamia
Abstract
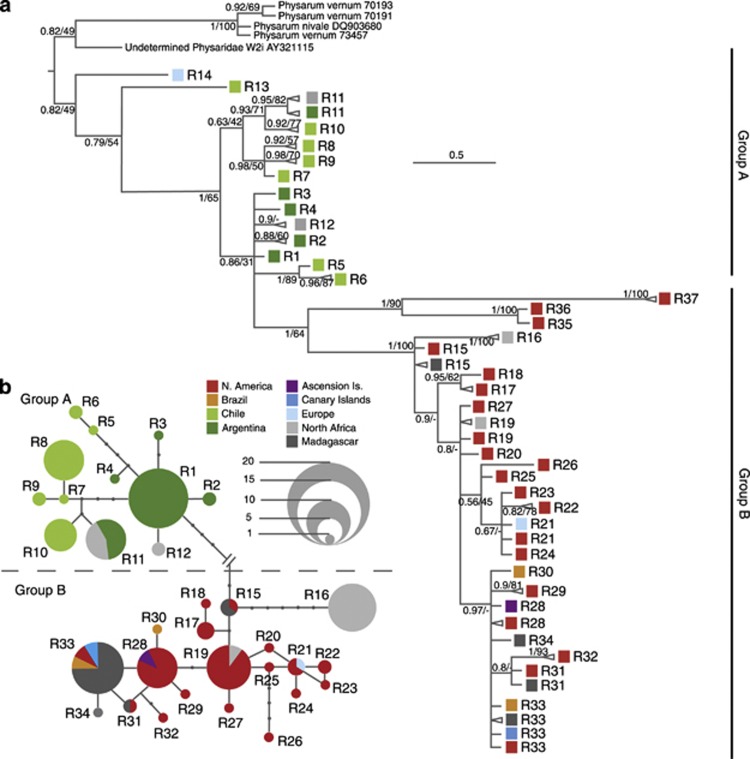
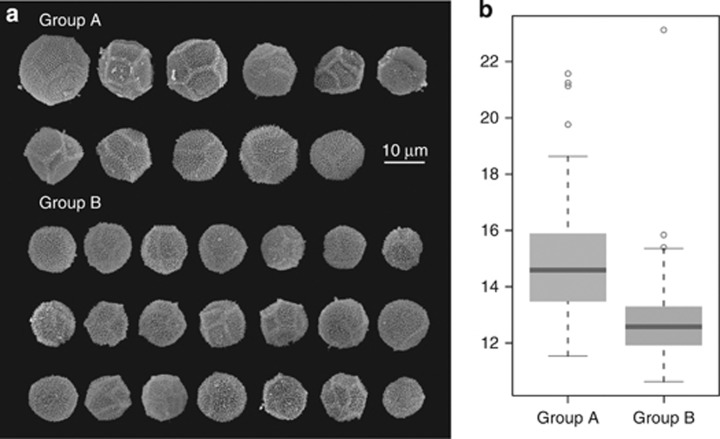
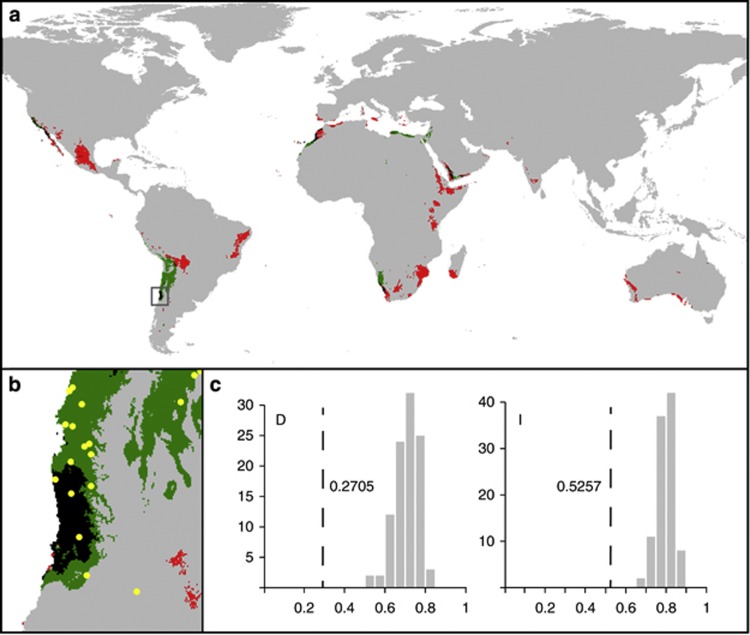
It is often discussed whether the biogeography of free-living protists is better explained by the 'everything is everywhere'(EiE) hypothesis, which postulates that only ecology drives their distribution, or by the alternative hypothesis of 'moderate endemicity' in which geographic barriers can limit their dispersal. To formally test this, it would be necessary not only to find organisms restricted to a geographical area but also to check for their presence in any other place with a similar ecology. We propose the use of environmental niche models to generate and test null EiE distributions. Here we have analysed the distribution of 18S rDNA variants (ribotypes) of the myxomycete Badhamia melanospora (belonging to the protozoan phylum Amoebozoa) using 125 specimens from 91 localities. Two geographically structured groups of ribotypes congruent with slight morphological differences in the spores can be distinguished. One group comprises all populations from Argentina and Chile, and the other is formed by populations from North America together with human-introduced populations from other parts of the world. Environmental climatic niche models constructed separately for the two groups have significant differences, but show several overlapping areas. However, only specimens from one group were found in an intensively surveyed area in South America where both niche models overlap. It can be concluded that everything is not everywhere for B. melanospora. This taxon constitutes a complex formed by at least two cryptic species that probably diverged allopatrically in North and South America.
Figures
Similar articles
-
Speciation in progress? A phylogeographic study among populations of Hemitrichia serpula (Myxomycetes).PLoS One. 2017 Apr 17;12(4):e0174825. doi: 10.1371/journal.pone.0174825. eCollection 2017. PLoS One. 2017. PMID: 28414791 Free PMC article.
-
Ecological niche models reveal the importance of climate variability for the biogeography of protosteloid amoebae.ISME J. 2012 Aug;6(8):1506-14. doi: 10.1038/ismej.2012.12. Epub 2012 Mar 8. ISME J. 2012. PMID: 22402402 Free PMC article.
-
Nivicolous Stemonitales from the Austral Andes: analysis of morphological variability, distribution and phenology as a first step toward testing the large-scale coherence of species and biogeographical properties.Mycologia. 2015 Mar-Apr;107(2):258-83. doi: 10.3852/14-164. Epub 2014 Dec 30. Mycologia. 2015. PMID: 25550302
-
The nineteenth century roots of 'everything is everywhere'.Nat Rev Microbiol. 2007 Aug;5(8):647-51. doi: 10.1038/nrmicro1711. Nat Rev Microbiol. 2007. PMID: 17603517 Review.
-
A summary of Blastocystis subtypes in North and South America.Parasit Vectors. 2019 Jul 29;12(1):376. doi: 10.1186/s13071-019-3641-2. Parasit Vectors. 2019. PMID: 31358042 Free PMC article. Review.
Cited by
-
Prokaryotic Diversity in Mangrove Sediments across Southeastern China Fundamentally Differs from That in Other Biomes.mSystems. 2019 Sep 10;4(5):e00442-19. doi: 10.1128/mSystems.00442-19. mSystems. 2019. PMID: 31506265 Free PMC article.
-
Distribution characteristics and diversity of myxomycetes in three parallel rivers in Yunnan, China.PLoS One. 2024 Jan 2;19(1):e0293260. doi: 10.1371/journal.pone.0293260. eCollection 2024. PLoS One. 2024. PMID: 38165993 Free PMC article.
-
Indication of spatially random occurrence of Chlamydia-like organisms in Bufo bufo tadpoles from ponds located in the Geneva metropolitan area.New Microbes New Infect. 2018 Nov 27;27:54-63. doi: 10.1016/j.nmni.2018.11.006. eCollection 2019 Jan. New Microbes New Infect. 2018. PMID: 30622711 Free PMC article.
-
Catalogue of fungi in China 4: Didymiaceae and Physaraceae (Myxomycetes).Mycology. 2024 Nov 7;16(1):124-157. doi: 10.1080/21501203.2024.2410508. eCollection 2025. Mycology. 2024. PMID: 40083410 Free PMC article.
-
Speciation in progress? A phylogeographic study among populations of Hemitrichia serpula (Myxomycetes).PLoS One. 2017 Apr 17;12(4):e0174825. doi: 10.1371/journal.pone.0174825. eCollection 2017. PLoS One. 2017. PMID: 28414791 Free PMC article.
References
-
- Amato A, Kooistra WHCF, Levialdi Ghiron JH, Mann DG, Pröschold T, Montresor M. Reproductive isolation among sympatric cryptic species in marine diatoms. Protist. 2007;158:193–207. - PubMed
-
- Aurahs R, Grimm GW, Hemleben V, Hemleben C, Kucera M. Geographical distribution of cryptic genetic types in the planktonic foraminifer Globigerinoides ruber. Mol Ecol. 2009;18:1692–1706. - PubMed
-
- Bass D, Howe AT, Mylnikov AP, Vickerman K, Chao EE, Smallbone JE, et al. Phylogeny and classification of Cercomonadidae: Cercomonas, Eocercomonas, Paracercomonas, and Cavernomonas gen. n. Protist. 2009;160:483–521. - PubMed
Publication types
MeSH terms
Substances
LinkOut - more resources
Full Text Sources
Other Literature Sources
Molecular Biology Databases
