. 2013 Nov 14;503(7475):267-71.
doi: 10.1038/nature12618. Epub 2013 Oct 16.

SHANK3 and IGF1 restore synaptic deficits in neurons from 22q13 deletion syndrome patients

Affiliations

SHANK3 and IGF1 restore synaptic deficits in neurons from 22q13 deletion syndrome patients

Aleksandr Shcheglovitov et al. Nature. .

Abstract

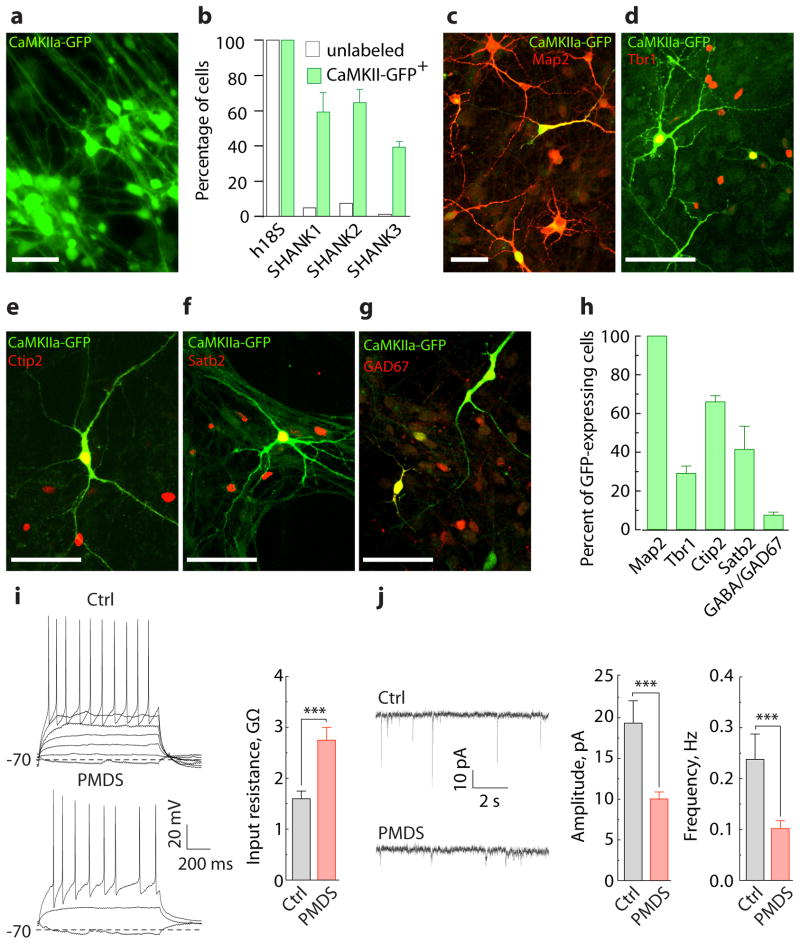
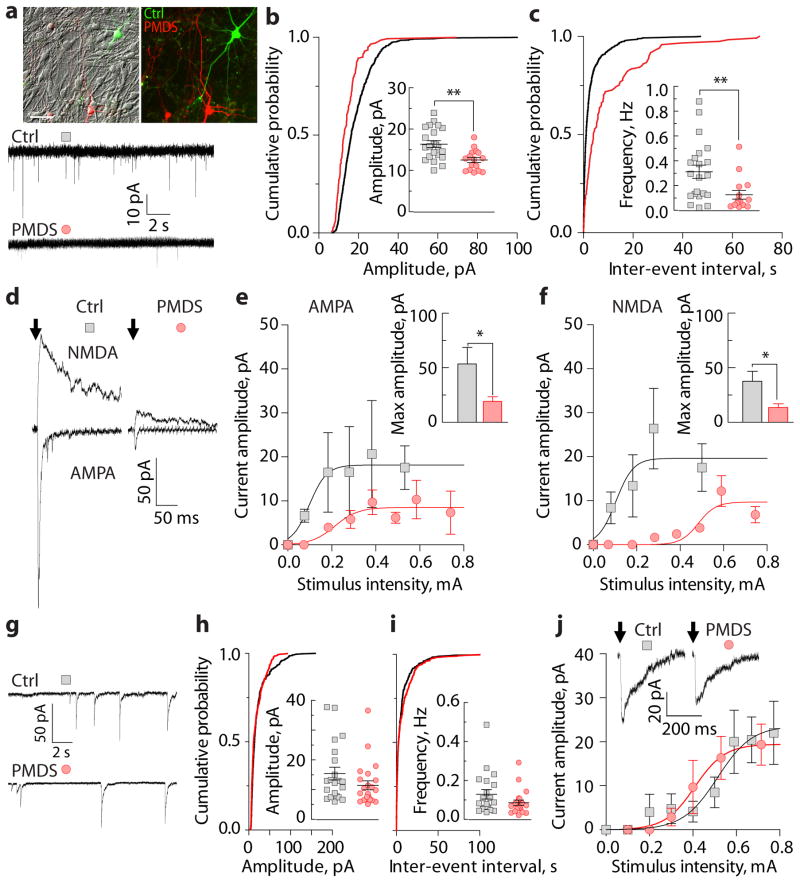
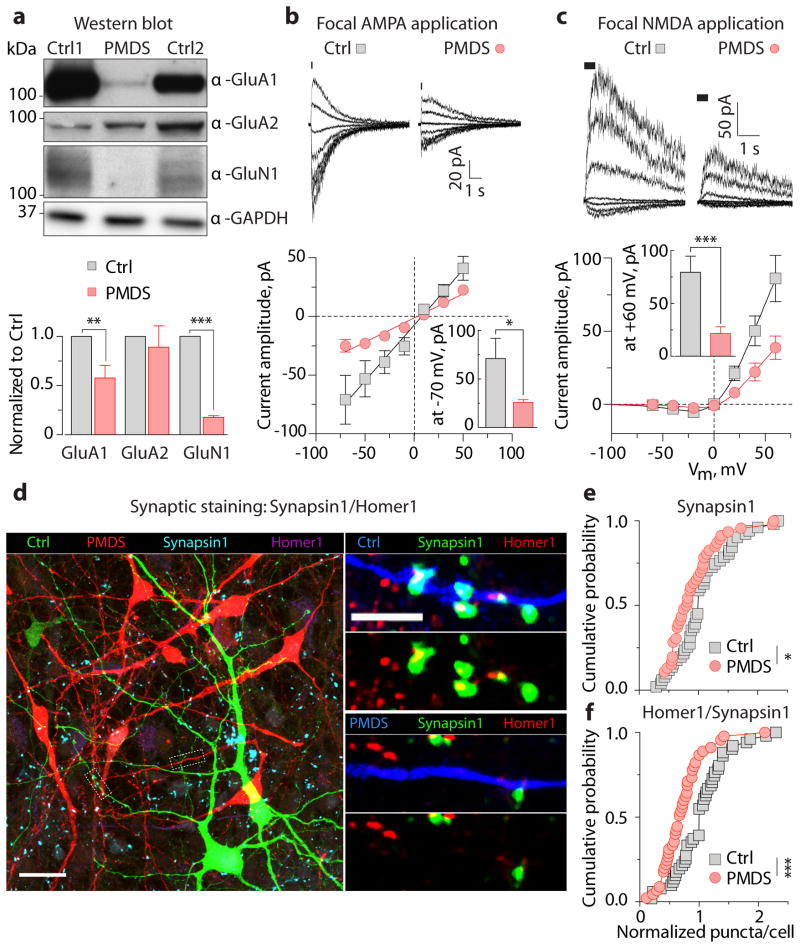
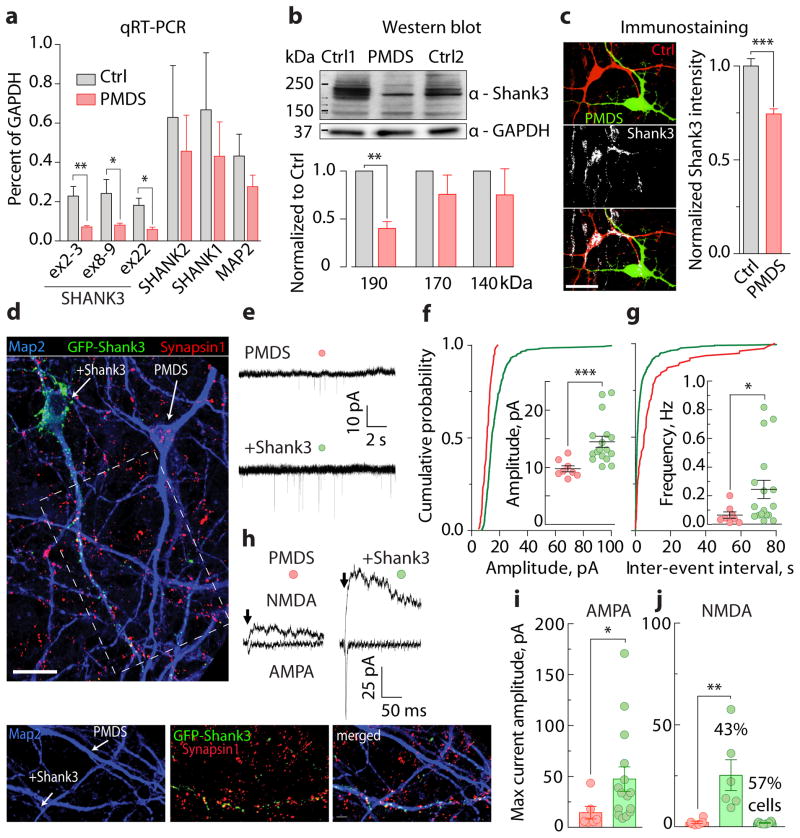
Phelan-McDermid syndrome (PMDS) is a complex neurodevelopmental disorder characterized by global developmental delay, severely impaired speech, intellectual disability, and an increased risk of autism spectrum disorders (ASDs). PMDS is caused by heterozygous deletions of chromosome 22q13.3. Among the genes in the deleted region is SHANK3, which encodes a protein in the postsynaptic density (PSD). Rare mutations in SHANK3 have been associated with idiopathic ASDs, non-syndromic intellectual disability, and schizophrenia. Although SHANK3 is considered to be the most likely candidate gene for the neurological abnormalities in PMDS patients, the cellular and molecular phenotypes associated with this syndrome in human neurons are unknown. We generated induced pluripotent stem (iPS) cells from individuals with PMDS and autism and used them to produce functional neurons. We show that PMDS neurons have reduced SHANK3 expression and major defects in excitatory, but not inhibitory, synaptic transmission. Excitatory synaptic transmission in PMDS neurons can be corrected by restoring SHANK3 expression or by treating neurons with insulin-like growth factor 1 (IGF1). IGF1 treatment promotes formation of mature excitatory synapses that lack SHANK3 but contain PSD95 and N-methyl-D-aspartate (NMDA) receptors with fast deactivation kinetics. Our findings provide direct evidence for a disruption in the ratio of cellular excitation and inhibition in PMDS neurons, and point to a molecular pathway that can be recruited to restore it.


Figures

Figure 1
Figure 1. CaMKIIα-GFP labels functional iPSC-derived forebrain neurons that express SHANK3
a, Image of iPSC-derived neurons labeled with EGFP under the control of CaMKIIα promoter. b, Fraction of cells expressing SHANK1-3, selected either randomly (unlabeled, n = 1 line/90 cells) or based on CaMKIIα-GFP expression (CaMKIIα-GFP+, n = 8 lines/90 cells) and assessed by multiplex single cell qRT-PCR (Supplementary Fig. 6). c–g, Images of iPSC-derived neurons immunostained with antibodies against GFP and Map2 (c), Tbr1 (d), Ctip2 (e), Satb2 (f), and GAD67 (g). h, Fraction of cells expressing Map2 (n = 3 cover slips (682 cells)), Tbr1 (n = 4 (566)), Ctip2 (n = 8 (853)), Satb2 (n = 6 (646)), and GABA/GAD67 (n = 5 (493)) among GFP-expressing cells. i, Representative recordings of APs (left, induced by somatic current injections, ΔI = 5 pA) and input resistance measurements (right) obtained from GFP-expressing control (n = 22 cells/3 lines) and PMDS neurons (n = 36 cells/5 lines). j, Representative recordings (left) and quantification of amplitude and frequency (right) of spontaneous EPSCs obtained from GFP-expressing control (n = 19 cells/3 lines) and PMDS neurons (n = 26 cells/5 lines) (Supplementary Table 4). Data presented as means ± SEMs; *** p < 0.001, Mann-Whitney test. Scale bars = 50 μm.
Figure 2
Figure 2. PMDS neurons display impaired excitatory synaptic transmission
a, Images of control (green) and PMDS (red) neurons co-cultured on a bed of rat cortical astrocytes (scale bar = 50 μm), top. Traces of spontaneous EPSCs recorded at −70 mV, bottom. b–c, Cumulative distribution and quantification of amplitude (b) and frequency (c) of spontaneous EPSCs (n = 22 control and 16 PMDS cells). d, Traces of evoked AMPA- (Vh = −70 mV) and NMDA-EPSCs (Vh = +60 mV). Arrows indicate the time of stimulation. Stimulation artifacts were blanked. e-f, Input-output curves of evoked AMPA- (measured at the peak; n = 15 control and 23 PMDS cells) and NMDA-EPSCs (measured 50 ms post-stimulus; n = 14 control and 20 PMDS cells) recorded in response to different stimulus intensities. Bar graphs show quantification of maximum current amplitude. g, Traces of spontaneous IPSCs recorded at −70 mV. h–i, Cumulative distribution and quantification of amplitude (h) and frequency (i) of spontaneous IPSCs (n = 21 control and 23 PMDS cells). j, Representative traces and input-output curves of evoked IPSCs (n = 17 control and 16 PMDS cells). Data presented as means ± SEMs; * p < 0.05, ** p < 0.01, Mann-Whitney test.
Figure 3
Figure 3. PMDS neurons show reduced expression of glutamate receptors and decreased number of synapses
a, Quantification of expression of AMPA and NMDA receptors in control and PMDS neurons using Western blot (D 45 – 50; n = 3 – 11 pairs of samples; ** p < 0.01, *** p < 0.001, one-sample t-test). GAPDH was used as a loading control. b–c, Representative currents (top) and peak current IV-curves (bottom) recorded in control and PMDS neurons in response to focal application of 200 μM AMPA (−70 – +50, Δ20 mV, n = 7 control and 11 PMDS cells) and 100 μM NMDA/10 μM Gly (−60 – +60, Δ20 mV, n = 21 control and 30 PMDS cells). Data presented as means ± SEMs; * p < 0.05, *** p < 0.001, Mann Whitney test. d, Images of co-cultured control (green) and PMDS (red) neurons immunostained for mKate2, GFP, Synapsin1, and Homer1. Scale bars = 20 (left) and 5 μm (right). e–f, Cumulative distributions of the number of Synapsin1+ (e) and Homer1+/Synapsin1+ (f) puncta on co-cultured control and PMDS neurons; * p < 0.05, *** p < 0.001, Kolmogorov-Smirnov test.
Figure 4
Figure 4. Reduced Shank3 expression contributs to synaptic defects in PMDS neurons
a, Relative expression of SHANK1, SHANK2, SHANK3, and MAP2 mRNAs in iPSC-derived neurons (D30 – D35; n = 5 control and 6 PMDS biological replicates; * p < 0.05, ** p < 0.01, Student’s t-test). b, Quantification of Shank3 expression in control and PMDS neurons as assessed by Western blot (D45 – 50; n = 4 pairs of samples; ** p < 0.01, one-sample t-test). GAPDH was used as a loading control. c, Images (left) and quantification (right) of Shank3 expression in co-cultured control (red) and PMDS (green) neurons (scale bar = 20 μm). d, Images of PMDS neurons infected with GFP-Shank3 lentiviruses and immunostained with antibodies against Map2, GFP, and Synapsin1 (scale bars = 20 (top) and 5 (bottom) μm). e, Traces of spontaneous EPSCs recorded from uninfected and Shank3-infected PMDS neurons at −70 mV. f–g, Cumulative distribution and quantification of amplitude (f) and frequency (g) of spontaneous EPSCs (n = 8 uninfected and 17 Shank3-infected cells). h, Traces of evoked AMPA- (Vh = −70 mV) and NMDA-EPSCs (Vh = +60 mV). i–j, Quantification of maximum amplitudes of evoked AMPA- (i, measured at peak) and NMDA-EPSCs (j, measured 50 ms post stimulus) recorded from uninfected (n = 6) and Shank3-infected (n = 14) PMDS neurons. Data presented as means ± SEMs; * p < 0.05, *** p < 0.001, Mann-Whitney test.
Figure 5
Figure 5. IGF1 treatment restores excitatory synaptic transmission in PMDS neurons
a, Quantification of the number of Homer1+/Synapsin1+ puncta in co-cultured neurons after treatment with different agents (untreated: n = 51 control, 43 PMDS cells; TSA: n = 11/12, VPA: n = 25/29, Nif: n = 9/8, IGF2: n = 31/40, IGF1: n = 35/32). b, Images of co-cultured control (green) and PMDS (red) neurons after IGF1 treatment. Scale bars = 20 (top) and 5 (bottom) μm. c, Recordings (top) and quantification of amplitude and frequency (bottom) of spontaneous EPSCs recorded in IGF1-treated cultures at −70 mV (n = 18 control and 25 PMDS cells). d, Recordings (top) and quantification of amplitudes (bottom) of evoked AMPA- (measured at the peak, Vh = −70 mV) and NMDA-EPSCs (measured 50 ms post-stimulus, Vh = +60 mV) acquired in IGF1-treated cultures (n = 14 control and 21 PMDS cells). Dashed lines represent data originally presented in Fig. 2. e, Images of co-cultured control (green) and PMDS (red) neurons in untreated (top) and IGF1-treated (bottom) cultures, immunostained with antibodies against GFP, mKate2, Shank3, and PSD95. Scale bars = 20 (left) and 5 (right) μm. f, Quantification of the number of Shank3+, PSD95+, and Shank3/PSD95+ puncta in co-cultured control (w/o, n = 25 cells; IGF1, 21 cells) and PMDS (w/o, n = 33 cells; IGF1, 25 cells) neurons. Values were normalized to the mean values acquired from control neurons in untreated cultures. g, Mean normalized traces (left) and quantification of the decay kinetics (right) of NMDA-EPSCs recorded from control (w/o, n = 9; IGF1, 12) and PMDS (w/o, n = 18; IGF1, 18, GFP-Shank3, 6) neurons. Data presented as means ± SEMs; *p < 0.05, **p < 0.01, ***p < 0.001, one-way ANOVA with Bonferroni’s test. h, Cartoon depicting possible mechanisms for the recovery of synaptic transmission in PMDS neurons.

References

    1. Phelan K, McDermid HE. The 22q13.3 Deletion Syndrome (Phelan-McDermid Syndrome) Mol Syndromol. 2012;2:186–201. 000334260. - PMC - PubMed
    1. Boeckers TM, Bockmann J, Kreutz MR, Gundelfinger ED. ProSAP/Shank proteins - a family of higher order organizing molecules of the postsynaptic density with an emerging role in human neurological disease. J Neurochem. 2002;81:903–910. - PubMed
    1. Sheng M, Kim E. The Shank family of scaffold proteins. J Cell Sci. 2000;113(Pt 11):1851–1856. - PubMed
    1. Boccuto L, et al. Prevalence of SHANK3 variants in patients with different subtypes of autism spectrum disorders. Eur J Hum Genet. 2013;21:310–316. doi: 10.1038/ejhg.2012.175. - DOI - PMC - PubMed
    1. Durand CM, et al. Mutations in the gene encoding the synaptic scaffolding protein SHANK3 are associated with autism spectrum disorders. Nat Genet. 2007;39:25–27. doi: 10.1038/ng1933. - DOI - PMC - PubMed

Publication types

MeSH terms

Supplementary concepts