. 2013 Oct 17;502(7471):333-339.
doi: 10.1038/nature12634.

Mutational landscape and significance across 12 major cancer types

Affiliations

Mutational landscape and significance across 12 major cancer types

Cyriac Kandoth et al. Nature. .

Abstract

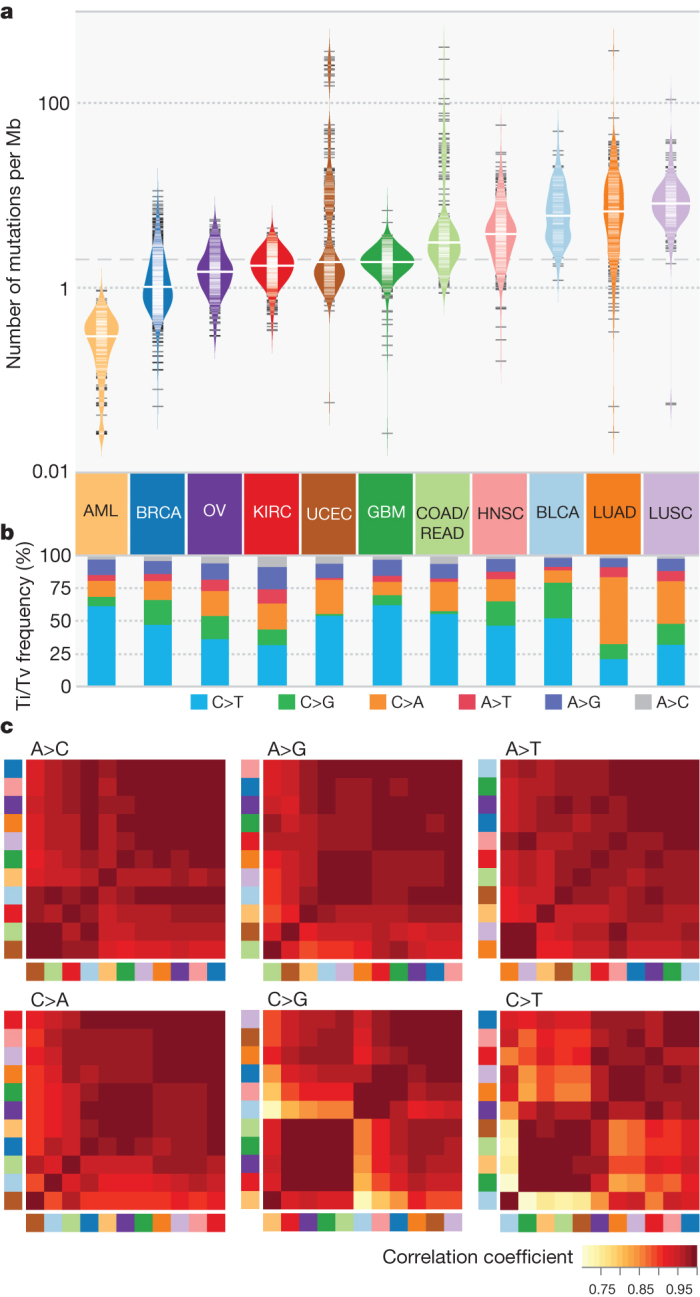
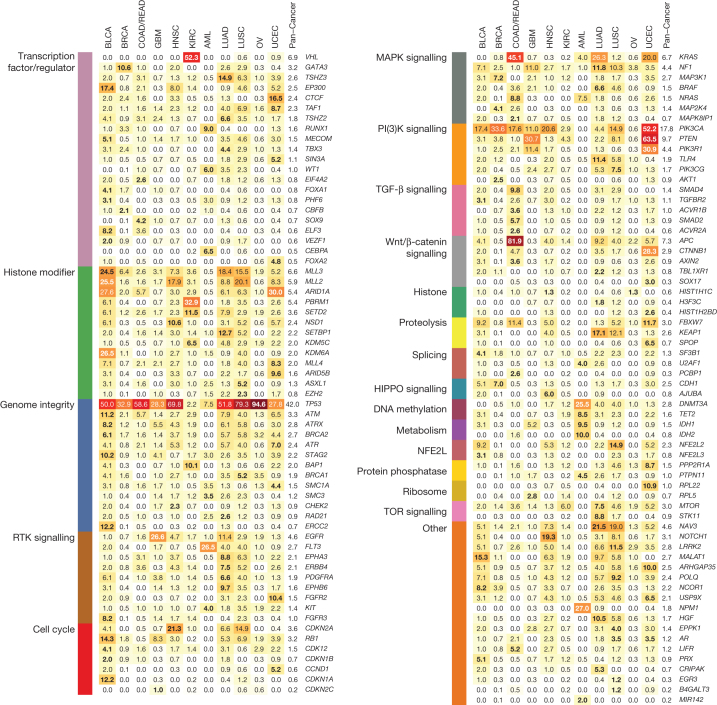
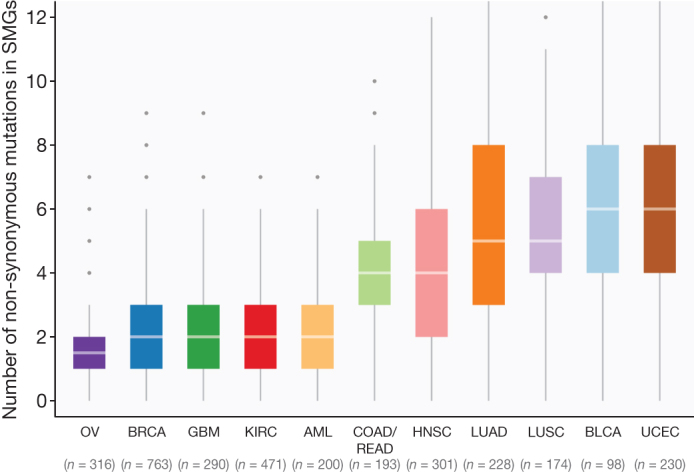
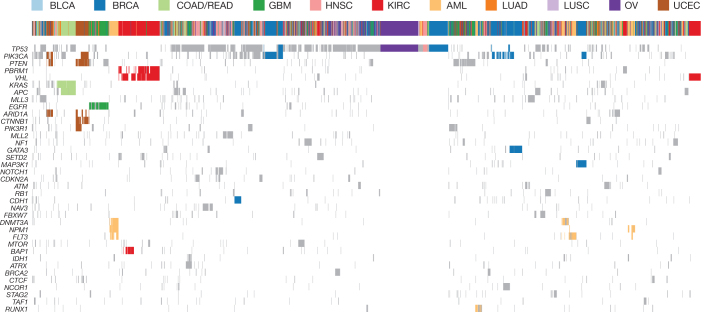
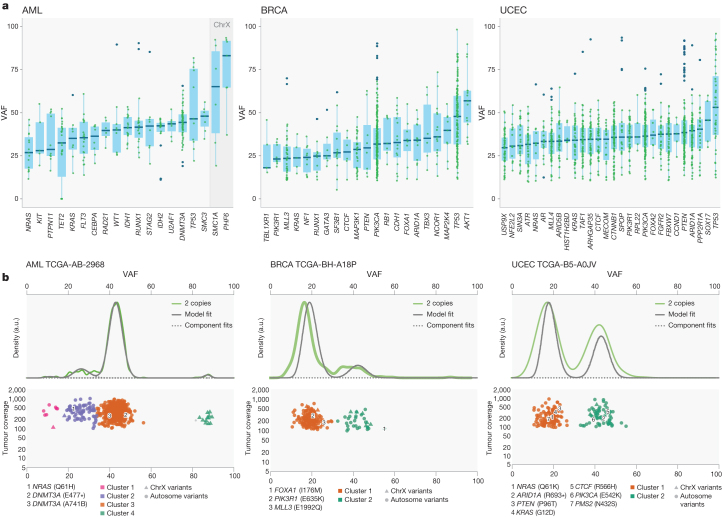
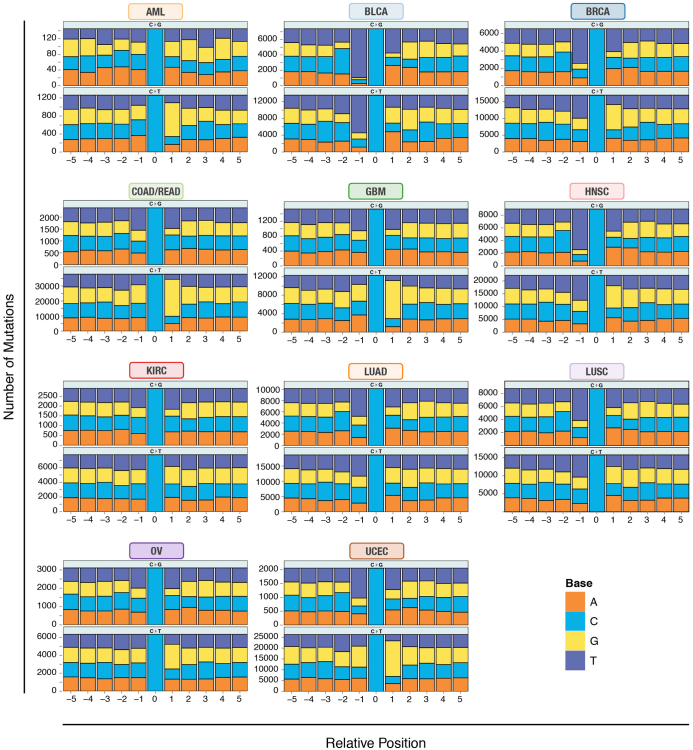
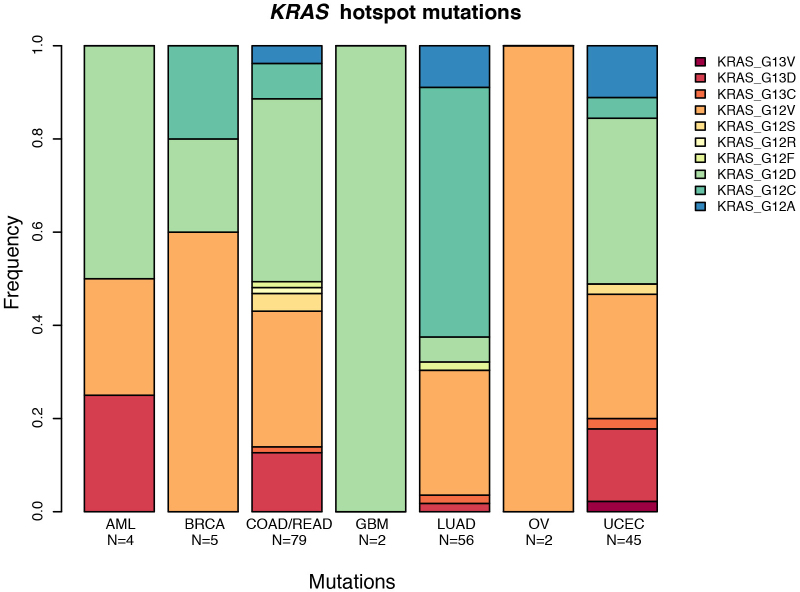
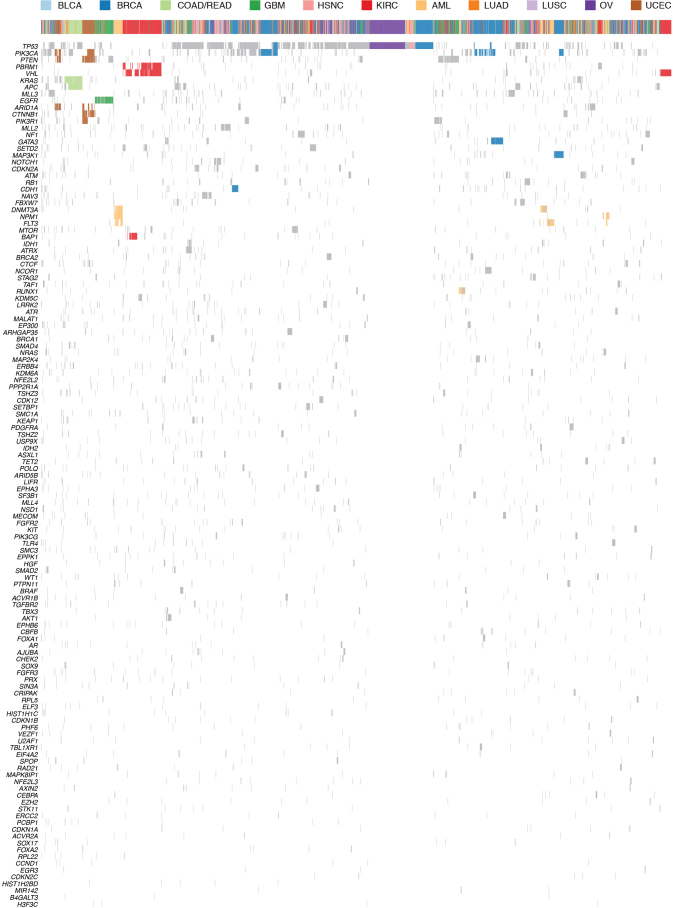
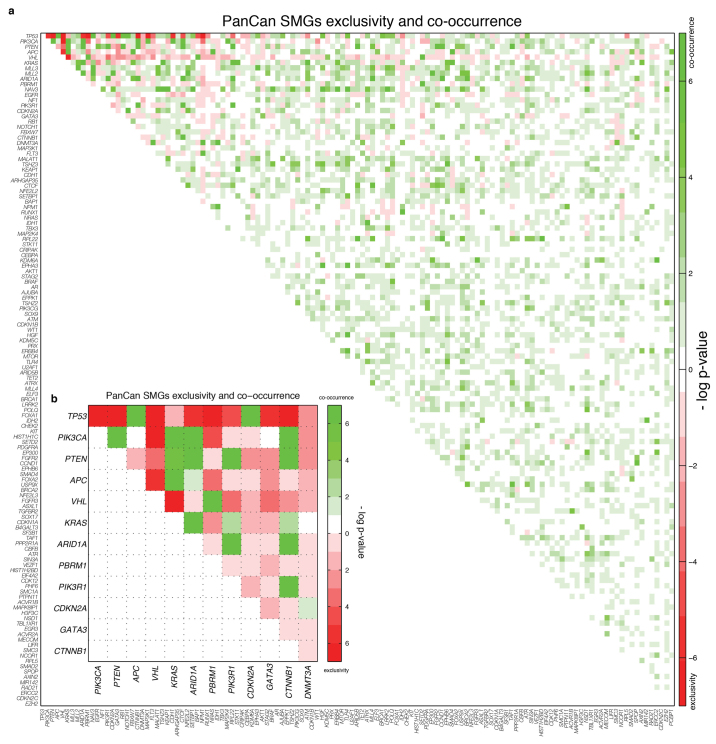
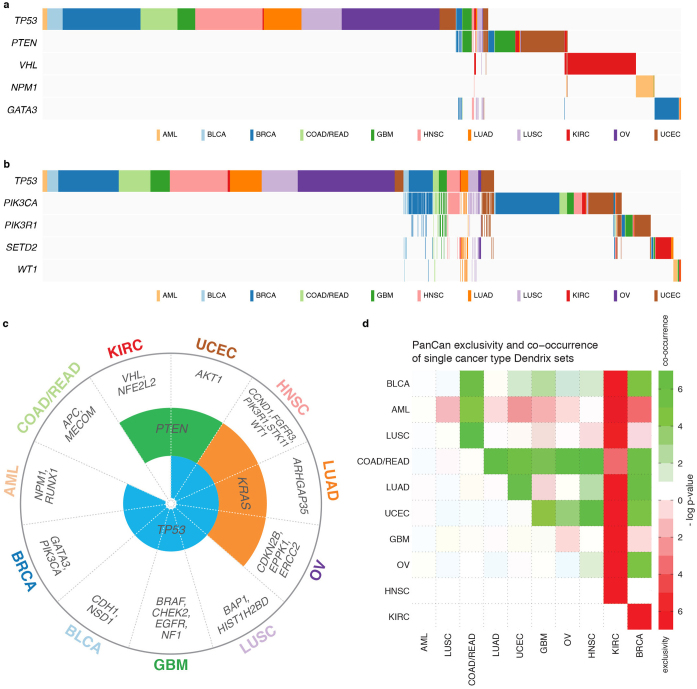
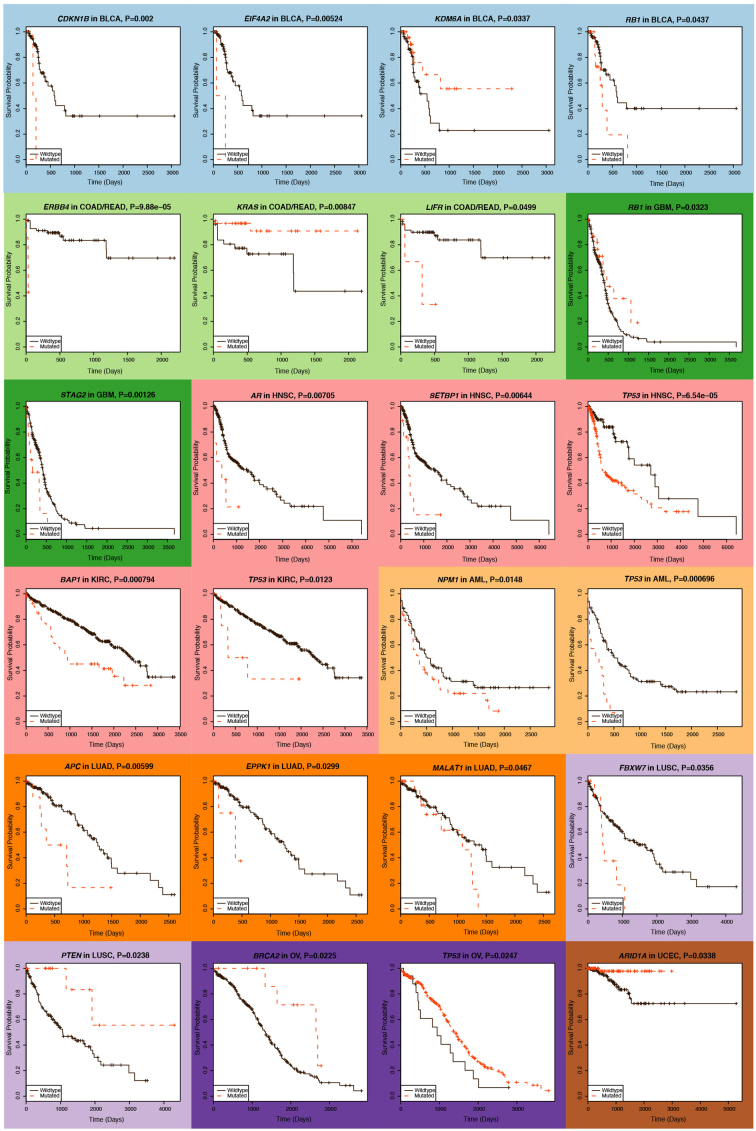
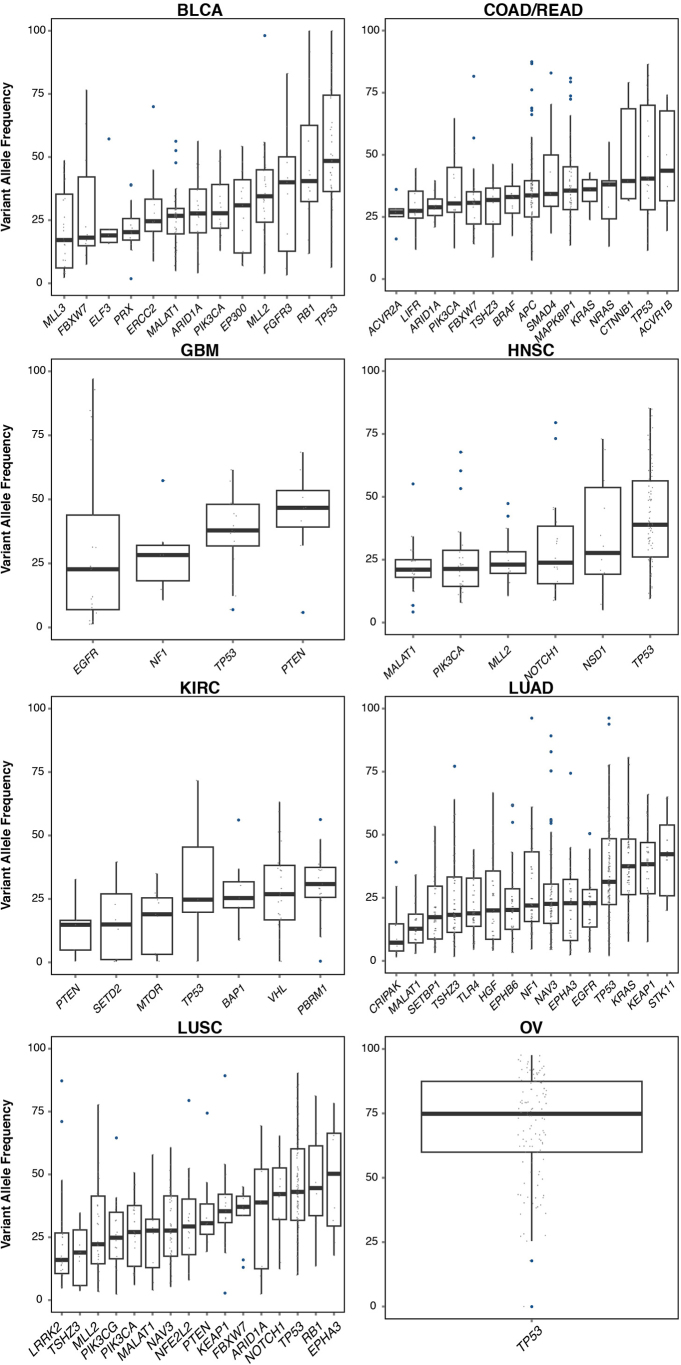
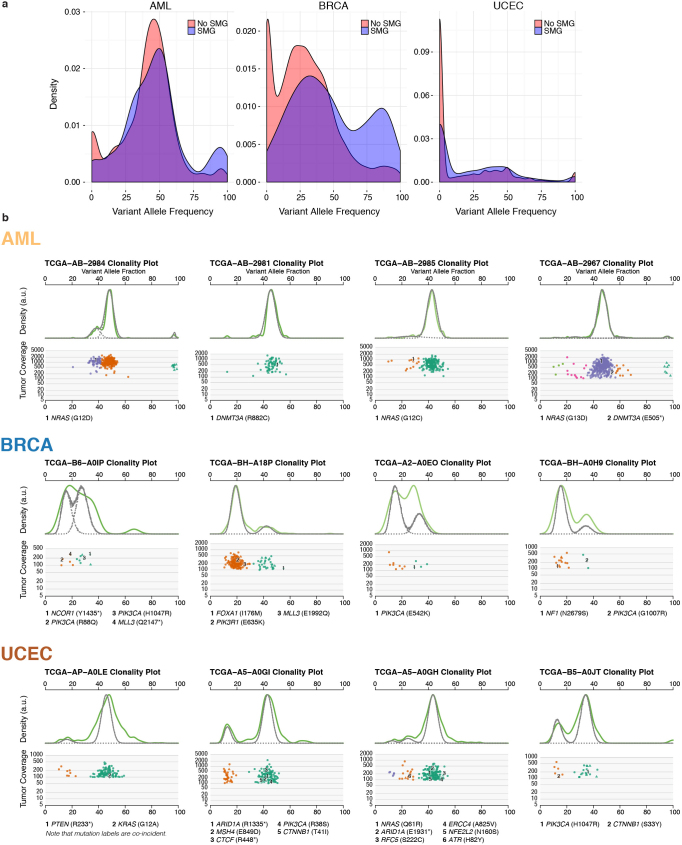
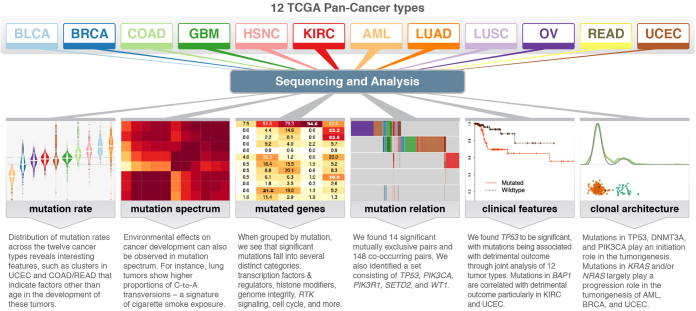
The Cancer Genome Atlas (TCGA) has used the latest sequencing and analysis methods to identify somatic variants across thousands of tumours. Here we present data and analytical results for point mutations and small insertions/deletions from 3,281 tumours across 12 tumour types as part of the TCGA Pan-Cancer effort. We illustrate the distributions of mutation frequencies, types and contexts across tumour types, and establish their links to tissues of origin, environmental/carcinogen influences, and DNA repair defects. Using the integrated data sets, we identified 127 significantly mutated genes from well-known (for example, mitogen-activated protein kinase, phosphatidylinositol-3-OH kinase, Wnt/β-catenin and receptor tyrosine kinase signalling pathways, and cell cycle control) and emerging (for example, histone, histone modification, splicing, metabolism and proteolysis) cellular processes in cancer. The average number of mutations in these significantly mutated genes varies across tumour types; most tumours have two to six, indicating that the number of driver mutations required during oncogenesis is relatively small. Mutations in transcriptional factors/regulators show tissue specificity, whereas histone modifiers are often mutated across several cancer types. Clinical association analysis identifies genes having a significant effect on survival, and investigations of mutations with respect to clonal/subclonal architecture delineate their temporal orders during tumorigenesis. Taken together, these results lay the groundwork for developing new diagnostics and individualizing cancer treatment.


Conflict of interest statement

The authors declare no competing financial interests.

Figures

Figure 1
Figure 1. Mutation frequencies, spectra and contexts across 12 cancer types.
a, Distribution of mutation frequencies across 12 cancer types. Dashed grey and solid white lines denote average across cancer types and median for each type, respectively. b, Mutation spectrum of six transition (Ti) and transversion (Tv) categories for each cancer type. c, Hierarchically clustered mutation context (defined by the proportion of A, T, C and G nucleotides within ±2 bp of variant site) for six mutation categories. Cancer types correspond to colours in a. Colour denotes degree of correlation: yellow (r = 0.75) and red (r = 1). PowerPoint slide
Figure 2
Figure 2. The 127 SMGs from 20 cellular processes in cancer identified in 12 cancer types.
Percentages of samples mutated in individual tumour types and Pan-Cancer are shown, with the highest percentage in each gene among 12 cancer types in bold. PowerPoint slide
Figure 3
Figure 3. Distribution of mutations in 127 SMGs across Pan-Cancer cohort.
Box plot displays median numbers of non-synonymous mutations, with outliers shown as dots. In total, 3,210 tumours were used for this analysis (hypermutators excluded). PowerPoint slide
Figure 4
Figure 4. Unsupervised clustering based on mutation status of SMGs.
Tumours having no mutation or more than 500 mutations were excluded. A mutation status matrix was constructed for 2,611 tumours. Major clusters of mutations detected in UCEC, COAD, GBM, AML, KIRC, OV and BRCA were highlighted. Complete gene list shown in Extended Data Fig. 3. PowerPoint slide
Figure 5
Figure 5. Driver initiation and progression mutations and tumour clonal architecture.
a, Variant allele fraction (VAF) distribution of mutations in SMGs across tumours from AML, BRCA and UCEC for mutations (≥20× coverage) in copy neutral segments. SMGs having ≥5 mutation data points were included. ChrX, chromosome X. b, In AML sample TCGA-AB-2968 (WGS), two DNMT3A mutations are in the founding clone, and one NRAS mutation is in the subclone. In BRCA tumour TCGA-BH-A18P (exome), one FOXA1 mutation is in the founding clone, and PIK3R1 and MLL3 mutations are in the subclone. In UCEC tumour TCGA-B5-A0JV (exome), PIK3CA, ARID1A and CTCF mutations are in the founding clone, and NRAS, PTEN and KRAS mutations are in the secondary clone. Asterisk denotes stop codon. PowerPoint slide
Extended Data Figure 1
Extended Data Figure 1. Mutation context across 12 cancer types.
Mutation context showing proportions of A, T, C and G nucleotides within ±5 bp for all validated mutations of type C>G/G>C and C>T/G>A across all 12 cancer types. The y axis denotes the total number of mutations in each category.
Extended Data Figure 2
Extended Data Figure 2. The distribution of KRAS hotspot mutations across tumour types.
Distribution of changes caused by mutations of the KRAS hotspot at amino acids 12 and 13. Lung adenocarcinoma has a significantly higher proportion of Gly12Cys mutations than other cancers (P < 3.2 × 10−10), caused by the increase in C>A transversions in the genomic DNA at that location.
Extended Data Figure 3
Extended Data Figure 3. Unsupervised clustering based on mutation status of SMGs.
Tumours having no mutation or more than 500 mutations were excluded to reduce noise. A mutation status matrix was constructed for 2,611 tumours. Major clusters of mutations detected in UCEC, COAD, GBM, AML, KIRC, OV and BRCA were highlighted. The shorter version is shown in Fig. 4.
Extended Data Figure 4
Extended Data Figure 4. Mutation relation analysis in individual tumour types and the Pan-Cancer set.
a, Exclusivity and co-occurrence between SMGs in each tumour type. The −log10 P value appears in either red or green if the pair shows exclusivity or co-occurrence, respectively. b, Exclusivity and co-occurrence between genes in the most significant (q < 0.05) pairs in Pan-Cancer set. Colour scheme is as in a.
Extended Data Figure 5
Extended Data Figure 5. Mutually exclusive mutations identified by Dendrix in the Pan-Cancer and individual cancer type data sets.
a, The highest scoring exclusive set of mutated genes in 127 SMGs contains several genes that are strongly associated with one cancer type. b, The highest scoring exclusive set of mutations in the top 600 genes (not enriched for mutations in one cancer type) reported by MuSiC. c, Relationships between exclusive gene sets identified by Dendrix in individual cancer types. Eight types include TP53 in the most exclusive set, three include KRAS, and two include PTEN, with the remaining genes appearing in only a single type. d, Exclusivity and co-occurrence assessed at the Pan-Cancer level. The −log10 P value appears in red or green if the pair shows exclusivity or co-occurrence, respectively. KIRC is most exclusive to other tumour types, whereas COAD/READ presented strong co-occurrence with other types.
Extended Data Figure 6
Extended Data Figure 6. Kaplan–Meier plots for genes significantly associated with survival.
Plots are shown for 24 genes showing significant (P ≤ 0.05) association in individual cancer types. Although NPM1 mutations in patients with AML having intermediate cytogenetic risk are relatively benign in the absence of internal tandem duplications in FLT3, we did not stratify patients based on cytogenetics or FLT3 internal tandem duplication status in this analysis, and cannot discern this effect. Because most patients with OV (95%) have TP53 mutations, we could not obtain sufficient non-TP53 mutant controls for confidently dissecting the relationship between TP53 status and survival in OV.
Extended Data Figure 7
Extended Data Figure 7. VAF distribution of mutations in SMGs across tumours from BLCA, KIRC, HNSC, LUAD, LUSC, COAD/READ, OV and GBM.
To minimize the effect of copy number alterations on VAFs, only mutations residing in copy number neutral segments were used for this analysis. Only mutation sites with ≥20× coverage were used for analysis and plotting. SMGs with at least five data points were included in the plot.
Extended Data Figure 8
Extended Data Figure 8. Mutation expression and tumour clonal architecture in AML, BRCA and UCEC.
a, Density plots of expressed VAFs for mutations in SMGs (blue) and non-SMGs (red). b, SciClone clonality example plots for AML (validation data), BRCA and UCEC. Two plots are shown for each case: kernel density (top), followed by the plot of tumour VAF by sequence depth for sites from selected copy number neutral regions. Mutations (with annotations) in SMGs were shown.
Extended Data Figure 9
Extended Data Figure 9. Summary of major findings in Pan-Cancer 12.
Systematic analysis of the TCGA Pan-Cancer mutation dataset identifies SMGs, cancer-related cellular processes, and genes associated with clinical features and tumour progression.

Comment in

Similar articles

Cited by

References

    1. Larson DE, et al. SomaticSniper: identification of somatic point mutations in whole genome sequencing data. Bioinformatics. 2012;28:311–317. doi: 10.1093/bioinformatics/btr665. - DOI - PMC - PubMed
    1. Koboldt DC, et al. VarScan 2: somatic mutation and copy number alteration discovery in cancer by exome sequencing. Genome Res. 2012;22:568–576. doi: 10.1101/gr.129684.111. - DOI - PMC - PubMed
    1. Dees ND, et al. MuSiC: Identifying mutational significance in cancer genomes. Genome Res. 2012;22:1589–1598. doi: 10.1101/gr.134635.111. - DOI - PMC - PubMed
    1. Roth A, et al. JointSNVMix: a probabilistic model for accurate detection of somatic mutations in normal/tumour paired next-generation sequencing data. Bioinformatics. 2012;28:907–913. doi: 10.1093/bioinformatics/bts053. - DOI - PMC - PubMed
    1. Cibulskis K, et al. Sensitive detection of somatic point mutations in impure and heterogeneous cancer samples. Nature Biotechnol. 2013;31:213–219. doi: 10.1038/nbt.2514. - DOI - PMC - PubMed

Publication types

MeSH terms

Substances