. 2013 Dec;75(12):2551-74.
doi: 10.1007/s11538-013-9907-5. Epub 2013 Oct 9.

Control and modulation of fluid flow in the rat kidney

Affiliations

Control and modulation of fluid flow in the rat kidney

Ioannis Sgouralis et al. Bull Math Biol. 2013 Dec.

Abstract

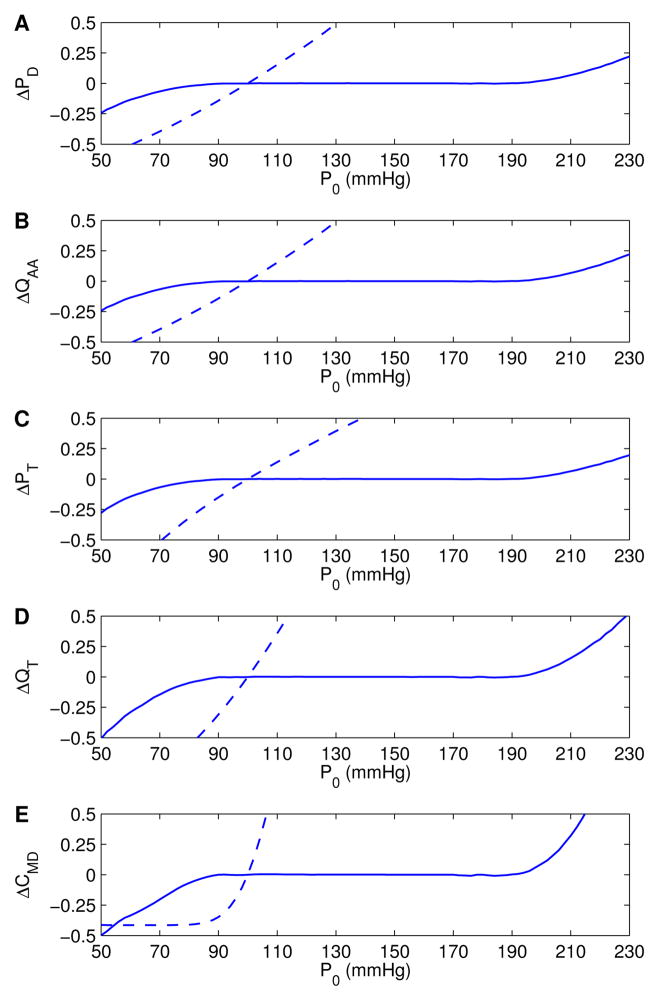
We have developed a mathematical model of the rat's renal hemodynamics in the nephron level, and used that model to study flow control and signal transduction in the rat kidney. The model represents an afferent arteriole, glomerular filtration, and a segment of a short-loop nephron. The model afferent arteriole is myogenically active and represents smooth muscle membrane potential and electrical coupling. The myogenic mechanism is based on the assumption that the activity of nonselective cation channels is shifted by changes in transmural pressure, such that elevation in pressure induces vasoconstriction, which increases resistance to blood flow. From the afferent arteriole's fluid delivery output, glomerular filtration rate is computed, based on conservation of plasma and plasma protein. Chloride concentration is then computed along the renal tubule based on solute conservation that represents water reabsorption along the proximal tubule and the water-permeable segment of the descending limb, and chloride fluxes driven by passive diffusion and active transport. The model's autoregulatory response is predicted to maintain stable renal blood flow within a physiologic range of blood pressure values. Power spectra associated with time series predicted by the model reveal a prominent fundamental peak at ∼165 mHz arising from the afferent arteriole's spontaneous vasomotion. Periodic external forcings interact with vasomotion to introduce heterodynes into the power spectra, significantly increasing their complexity.


Figures

Figure 1
Figure 1
Schematic diagram of the model nephron. Afferent arteriole is shown with a reduced number of vascular smooth muscles (VSM). Arrows indicate myogenic response (red), and key fluid flow variables (black).
Figure 2
Figure 2
Base-case predictions. A1, A2: pressure and flow rate in the afferent arteriole (AA); B1, B2: pressure and flow rate along the proximal tubule and loop of Henle; C1, C2: tubular fluid Cl concentration at loop bend and macula densa, respectively.
Figure 3
Figure 3
Spatial profiles of fluid pressure (solid lines) and flow rate (dashed lines) along the afferent arteriole (A) and along the proximal tubule and loop of Henle (B). C: tubular fluid Cl concentration profile. Afferent arteriole and tubular lengths are normalized by LAA and LT, respectively. Dotted line indicate the position of the loop bend. Profiles change dynamically due to spontaneous vasomotion. Profiles shown are snapshots at time t = 25 s (see Fig. 2).
Figure 4
Figure 4
Autoregulatory responses to sustained steady P0 perturbations, obtained with (solid lines) and without (dashed lines) the myogenic response. Results are shown as deviations from base-case values, normalized by respective reference values (listed in Table III). A, B: afferent arteriole outflow pressure and flow rate, respectively; C, D: proximal tubule inflow pressure and flow rate, respectively; E: tubular fluid Cl concentration at macula densa.
Figure 5
Figure 5
Model responses to step-pressure changes in afferent arteriole inflow pressure. Solid lines: step-increase; dashed lines: step-decrease. A, B: afferent arteriole inflow and outflow pressures, respectively; C, D: proximal tubule inflow pressure and flow rate, respectively; E: tubular fluid Cl concentration at macula densa.
Figure 6
Figure 6
Proximal tubule inflow pressure responses to pressure perturbations at fext = 60 mHz (A1), 30 mHz (B1), and 0 mHz (C1, unperturbed pressure, i.e., Fig. 2B1). Corresponding power spectra are shown in A2, B2, C2, respectively. Dotted lines denote fext and vasomotion frequency fmyo.
Figure 7
Figure 7
Contour of power spectral density of proximal tubule inflow pressure obtained for forcing frequencies fext 0–250 mHz. Peaks arising from forcing (fext) and vasomotion (fmyo) are identified, as well as harmonics and major heterodynes.
Figure 8
Figure 8
Proximal tubule inflow pressure responses to pressure perturbations at fext = 60 mHz (A1) and 30 mHz (B1), obtained with the myogenic response disabled. Corresponding power spectra are shown in A2, B2, respectively. Dotted lines denote fext and vasomotion frequency fmyo.
Figure 9
Figure 9
Pressure, flow, and [Cl] oscillations, driven by sinusoidal pressure forcing at 30 mHz, obtained at proximal tubule entrance (top row), loop bend (middle row), and macula densa (bottom row). Time courses have been normalized by respective reference values (listed in Table III).
Figure 10
Figure 10
Proximal tubule inflow pressure responses to electrical perturbations at fext = 60 mHz (row A) and 30 mHz (row B), and corresponding power spectra. Dotted lines denote fext and vasomotion frequency fmyo.

Similar articles

Cited by

References

    1. Chen J, Sgouralis I, Moore LC, Layton HE, Layton AT. A mathematical model of the myogenic response to systolic pressure in the afferent arteriole. Am J Physiol Renal Physiol. 2011;300:F669–F681. - PMC - PubMed
    1. Chon KH, Raghavan R, Chen Y-M, Marsh DJ, Yip K-P. Interactions of TGF-dependent and myogenic oscillations in tubular pressure. Am J Physiol|Renal Physiol. 2005;288:F298–F307. - PubMed
    1. Cortell S, Gennari FJ, Davidman M, Bossert WH, Schwartz WB. A definition of proximal and distal tubular compliance. practical and theoretical implications. J Clin Invest. 1973 Sep;52(9):2330–9. - PMC - PubMed
    1. Cupples WA, Braam B. Assessment of renal autoregulation. American Journal of Physiology-Renal Physiology. 2007;292(4):F1105–F1123. - PubMed
    1. Deen WM, Robertson CR, Brenner BM. A model of glomerular ultrafiltration in the rat. Am J Physiol. 1972;223(5):1178–1183. - PubMed

Publication types