Review
. 2014 Apr;35(7):937-55.
doi: 10.1002/elps.201300421. Epub 2013 Nov 27.

Clinical applications of capillary electrophoresis based immunoassays

Affiliations
Review

Clinical applications of capillary electrophoresis based immunoassays

Annette C Moser et al. Electrophoresis. 2014 Apr.

Abstract

Immunoassays have long been an important set of tools in clinical laboratories for the detection, diagnosis, and treatment of disease. Over the last two decades, there has been growing interest in utilizing CE as a means for conducting immunoassays with clinical samples. The resulting method is known as a CE immunoassay. This approach makes use of the selective and strong binding of antibodies for their targets, as is employed in a traditional immunoassay, and combines this with the speed, efficiency, and small sample requirements of CE. This review discusses the variety of ways in which CE immunoassays have been employed with clinical samples. An overview of the formats and detection modes that have been employed in these applications is first presented. A more detailed discussion is then given on the type of clinical targets and samples that have been measured or studied by using CE immunoassays. Particular attention is given to the use of this method in the fields of endocrinology, pharmaceutical measurements, protein and peptide analysis, immunology, infectious disease detection, and oncology. Representative applications in each of these areas are described, with these examples involving work with both traditional and microanalytical CE systems.

Keywords: Affinity capillary electrophoresis; CE immunoassay; Capillary electrophoresis; Clinical chemistry; Immunoassay.


Figures

Figure 1
Figure 1
(a) Scheme for a homogeneous non-competitive CE immunoassay and (b) some typical results for this method, as obtained by a technique for measuring carcinoembryonic antigen (CEA) in a serum sample from a cancer patient. In this type of assay, the sample is first mixed and incubated with an excess of labeled antibodies against the desired target analyte. CE is then used to separate the complex of the labeled antibodies with the target from the free, labeled antibodies that remain. The size of the peaks for either the labeled antibody complex with the target or the free labeled antibodies can then be used to determine how much of the target was in the sample. The electropherogram shown in (b) is reproduced with permission from Ref. [43].
Figure 2
Figure 2
(a) Scheme for a homogeneous competitive binding CE immunoassay and (b) some typical results for this approach, using a method reported for human serum albumin (HSA) as an example. In this technique, the sample and a fixed amount of a labeled analog of the analyte are combined with a limited amount of antibodies against the desired target. After being allowed to bind, the components of this mixture are separated by CE and the labeled species are detected. The amount of analyte in the original sample can be determined by measuring the relative amount of the labeled analog that is bound to the antibodies or that remains free in solution, with this response being comparing to what is obtained when standard samples are measured under the same conditions. Electropherograms shown in (b) are reproduced with permission from Ref. [48], in which Cyanine 5 (Cy5) was used as a fluorescent label.
Figure 3
Figure 3
(a) Scheme for a heterogeneous CE immunoassay based on the use of immobilized antibodies for immunoextraction and (b) some results for this approach, using a method reported for the analysis of several chemokines as an example. In this technique, the immobilized antibodies are first used to extract the analytes from a sample. After the non-retained sample components have been washed away, the retained analytes are then released for their separation and detection by CE. The electropherograms shown in (b) is reproduced with permission from Ref. [59], in peaks 1–6 represent fluorescent labeled analytes and “*” is the free dye label.
Figure 4
Figure 4
Immobilization of antigens from the bacterium Helicobacter pylori onto magnetic nanobeads (MNB) and the use of these immobilized antigens with CE to extract and analyze H. pylori antibodies in human serum. Once the antibodies against H. pylori had been captured, they were bound tagged with labeled secondary antibodies. After the antibodies had been released and separated by CE, they were detected by laser-induced fluorescence (LIF). Reproduced with permission from Ref. [70].
Figure 5
Figure 5
Structures of several common fluorescent dyes, in their activated forms, that have been used in CE immunoassays.
Figure 6
Figure 6
Electropherograms obtained by using on-line immunoextraction coupled with CE and mass spectrometry for the analysis of a plasma sample spiked with 100 ng/mL of endomorphin 1 (End1) and endomorphin 2 (End2). Reproduced with permission from Ref. [62].
Figure 7
Figure 7
(a) A microfluidic system for continuous monitoring of glucagon release from live islets of Langerhans in contact with a perfused solution containing a controlled concentration of glucose, and (b) the average release of glucagon over time from the cells in this system when going from an initial solution that contained 15 mM glucose to one that contained 1 mM glucose. The error bars in (b) represent ± 1 standard error of the mean (n = 4) and are shown for every fifth data point for the sake of clarity. Reproduced with permission from Ref. [98].
Figure 8
Figure 8
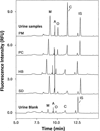
Use of a homogeneous competitive binding CE immunoassay to simultaneous examine several drugs of abuse in urine samples for patients (PM, PC, HB and SD) or a urine blank. The peaks shown in these electropherograms represent the free labeled tracers for methadone (M), D-amphetamine (A), morphine (O), benzoylecgonine (C), and the internal standard (IS). Terms: RFU, relative fluorescence unit. Adapted with permission form Ref. [26].
Figure 9
Figure 9
Scheme for a homogeneous competitive binding CE immunoassay with on-line mixing of reagents for human serum albumin (HSA) and using Cyanine 5 (Cy5) as a fluorescent label. This method is based on the introduction of the sample and reagents in different zones, which then react as the analyte and reagent bands cross each other due to their different electrophoretic mobilities. The on-line binding assay in (a) shows the expected result in this case for the addition of antibodies and a labeled analog of HSA, while the stepwise reaction immunoassay in (b) also includes a zone in which sample is applied between these two reagent layers. Reproduced with permission from Ref. [73].
Figure 10
Figure 10
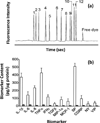
Use of immunoextraction, fluorescent labeling and CE for the simultaneous analysis of 12 inflammatory biomarkers. (a) Typical electrophorogram for a standard mixture of the biomarkers and (b) content of the biomarkers that were measured in patient lesions (open bars) versus a control group (filled bars). The error bars represent a range of ± 1 standard error of the mean. Abbreviations: IL-1β, interleukin-1 beta; IL-6, interleukin-6; IL-8, interleukin-8; TNFα, tumor necrosis factor-alpha; IFNγ, interferon gamma; TGFβ, transforming growth factor-beta; MIP-1α, macrophage inflammatory protein 1 alpha; MCP-1, macrophage chemoattractant protein 1; SP, substance P; CGRP, calcitonin gene-related peptide; NY, neuropeptide Y; VIP, vasoactive intestinal peptide. Adapted with permission from Ref. [24].
Figure 11
Figure 11
Analysis of L3 isoform of α-fetoprotein (AFP-L3) by a CE immunoassay combined with lectin affinity chromatography; AFP-L1 is the L1 isoform of the same protein. The results in (a) show a typical electropherogram for this method, in which the two markers represent fluorescent dyes that were used as mobility references for identification of AFP-L3 versus AFP-L1. The plot in (b) is a correlation chart that was obtained with the results of this method, in terms of %AFP-L3, were compared to those of a reference technique for a series of 98 patient serum samples. Adapted with permission from Ref. [41].

References

    1. Tietz NW, editor. Textbook of Clinical Chemistry. Philadelphia: Saunders; 1986.
    1. Clarke W, editor. Contemporary Practice in Clinical Chemistry. 2nd ed. Washington, DC: AACC Press; 2011.
    1. Wild D, editor. The Immunoassay Handbook. 4th ed. Amsterdam: Elsevier; 2013.
    1. Hage DS. Anal. Chem. 1999;71:294R–304R. - PubMed
    1. Hage DS. Anal. Chem. 1991;63:206R–209R. - PubMed

Publication types