. 2013 Dec;54(12):3506-15.
doi: 10.1194/jlr.M042481. Epub 2013 Oct 16.

Microvascular COX-2/mPGES-1/EP-4 axis in human abdominal aortic aneurysm

Affiliations

Microvascular COX-2/mPGES-1/EP-4 axis in human abdominal aortic aneurysm

Mercedes Camacho et al. J Lipid Res. 2013 Dec.

Abstract

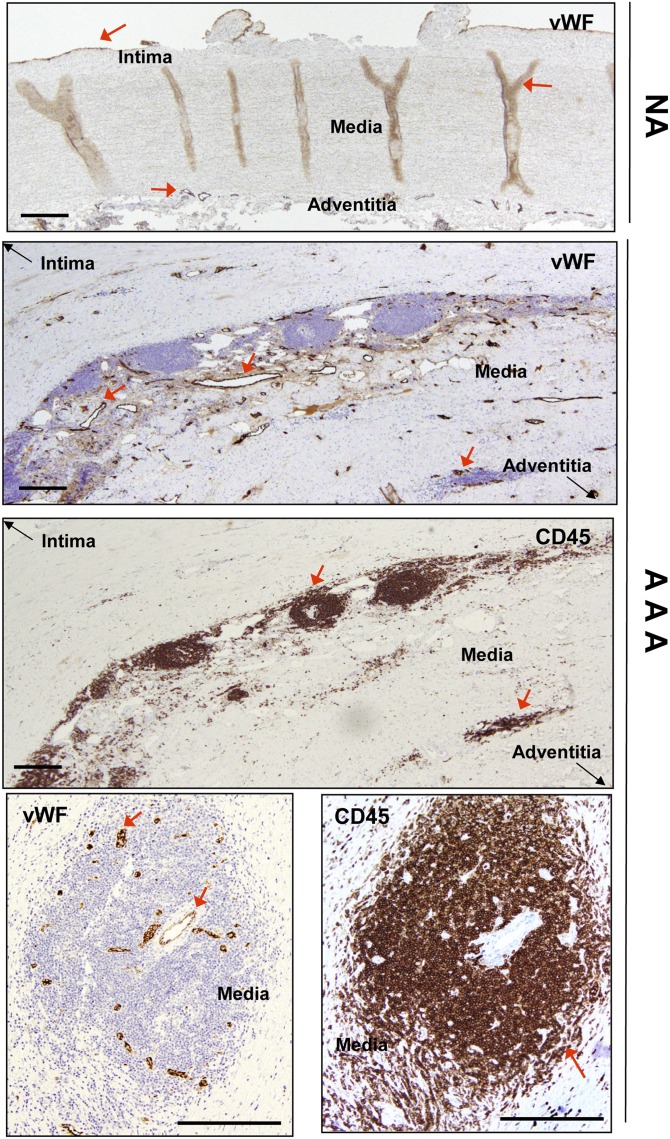
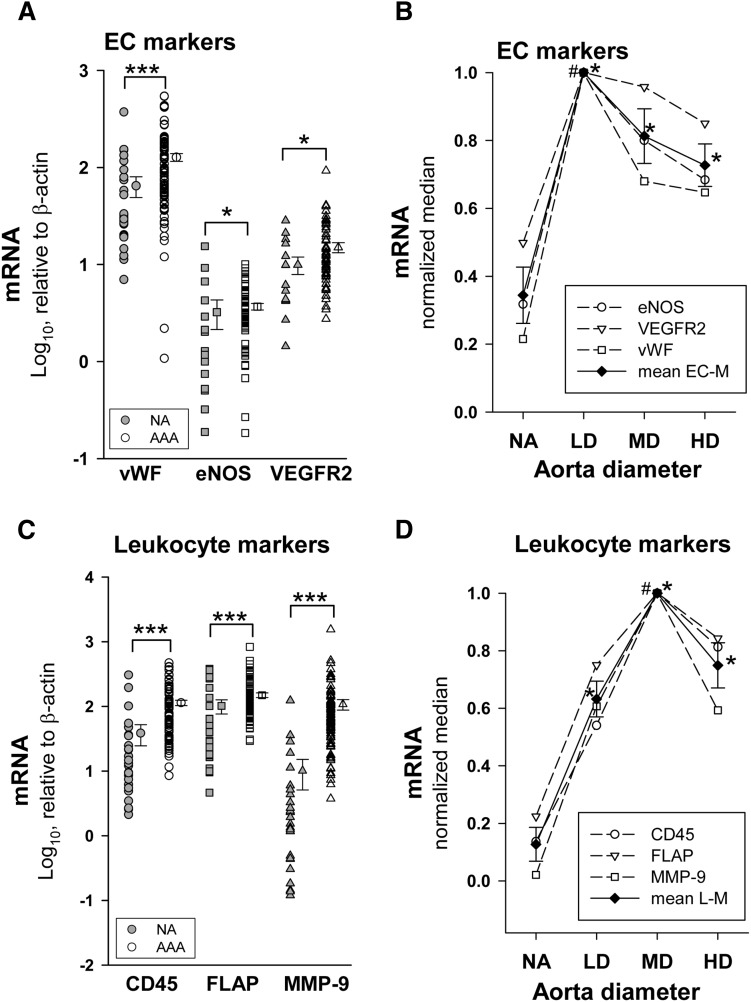
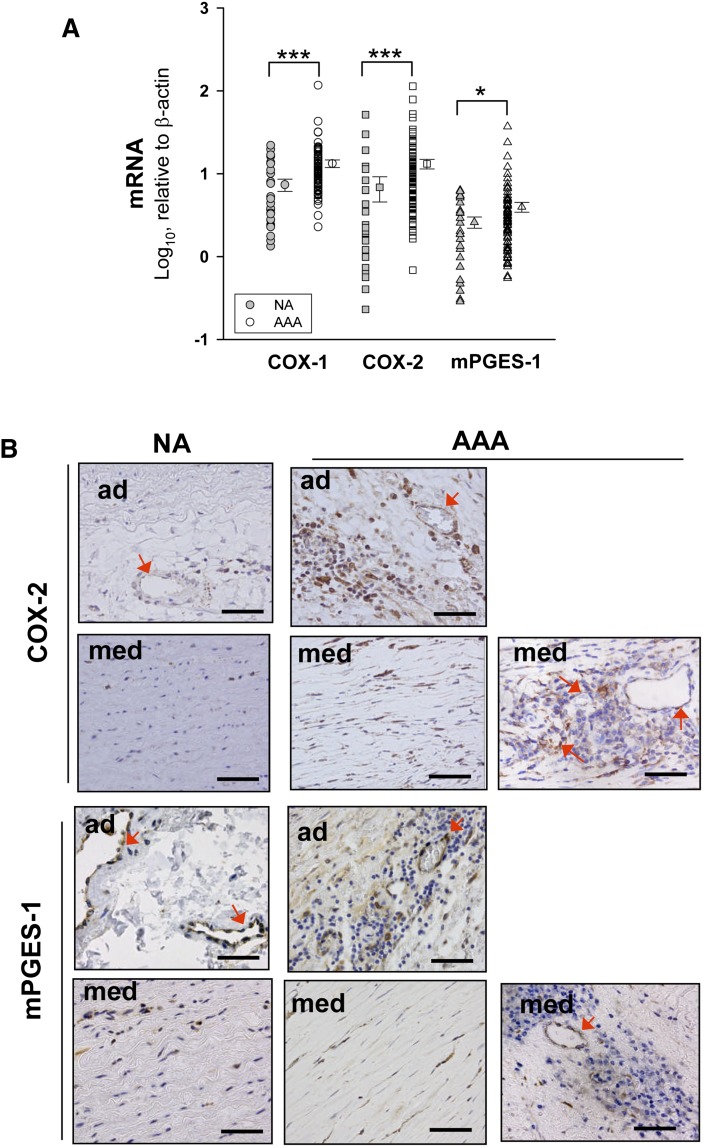
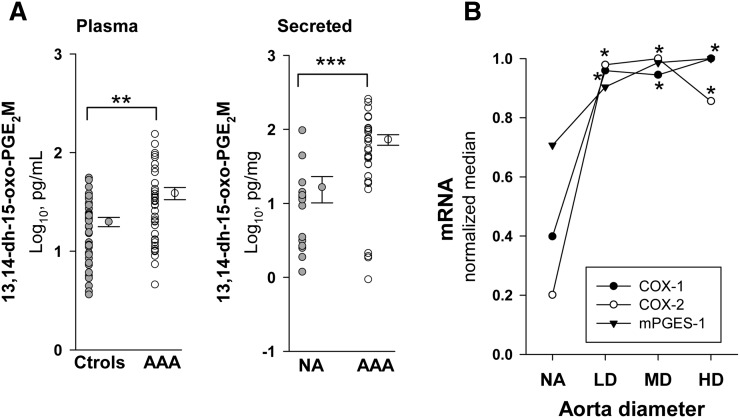
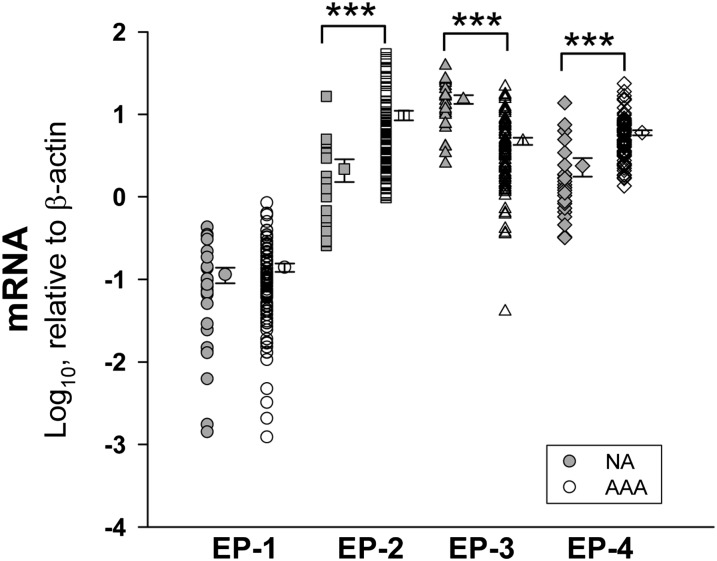
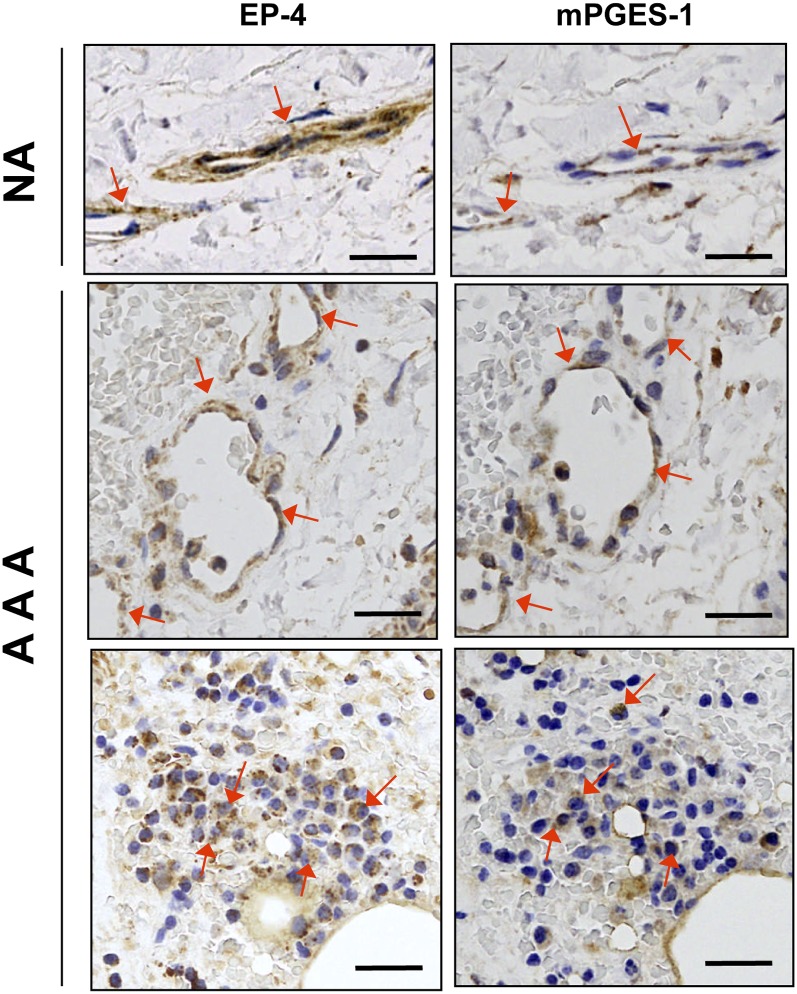
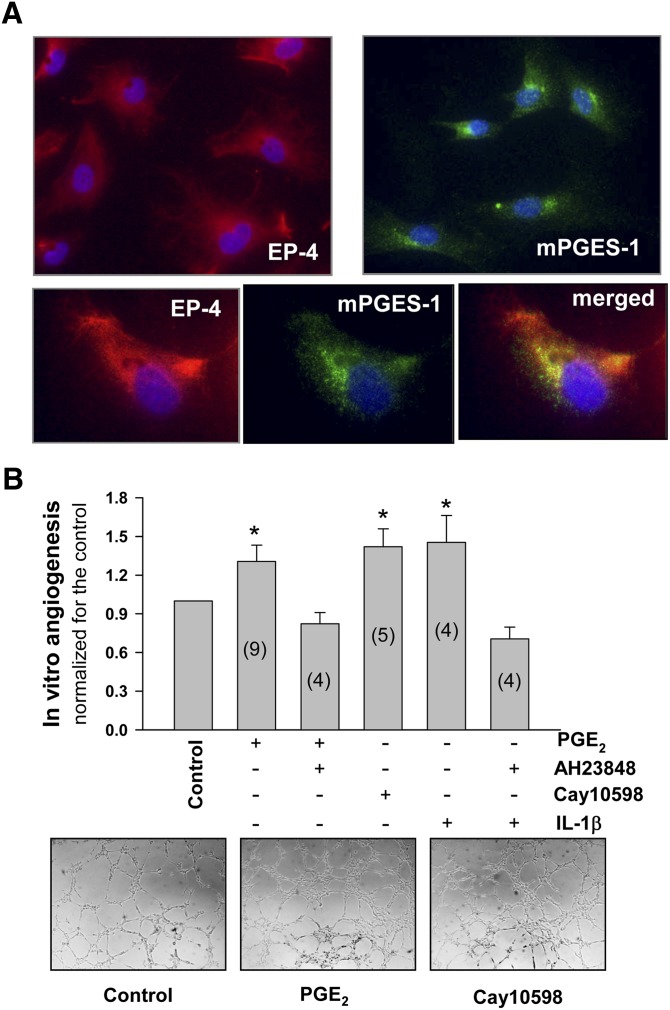
We investigated the prostaglandin (PG)E2 pathway in human abdominal aortic aneurysm (AAA) and its relationship with hypervascularization. We analyzed samples from patients undergoing AAA repair in comparison with those from healthy multiorgan donors. Patients were stratified according to maximum aortic diameter: low diameter (LD) (<55 mm), moderate diameter (MD) (55-69.9 mm), and high diameter (HD) (≥70 mm). AAA was characterized by abundant microvessels in the media and adventitia with perivascular infiltration of CD45-positive cells. Like endothelial cell markers, cyclooxygenase (COX)-2 and the microsomal isoform of prostaglandin E synthase (mPGES-1) transcripts were increased in AAA (4.4- and 1.4-fold, respectively). Both enzymes were localized in vascular cells and leukocytes, with maximal expression in the LD group, whereas leukocyte markers display a maximum in the MD group, suggesting that the upregulation of COX-2/mPGES-1 precedes maximal leukocyte infiltration. Plasma and in vitro tissue secreted levels of PGE2 metabolites were higher in AAA than in controls (plasma-controls, 19.9 ± 2.2; plasma-AAA, 38.8 ± 5.5 pg/ml; secretion-normal aorta, 16.5 ± 6.4; secretion-AAA, 72.9 ± 6.4 pg/mg; mean ± SEM). E-prostanoid receptor (EP)-2 and EP-4 were overexpressed in AAA, EP-4 being the only EP substantially expressed and colocalized with mPGES-1 in the microvasculature. Additionally, EP-4 mediated PGE2-induced angiogenesis in vitro. We provide new data concerning mPGES-1 expression in human AAA. Our findings suggest the potential relevance of the COX-2/mPGES-1/EP-4 axis in the AAA-associated hypervascularization.

Keywords: E prostanoid receptor; angiogenesis; cyclooxygenase; cyclooxygenase pathway; microsomal isoform of prostaglandin E synthase; prostaglandin.


Figures

Fig. 1.
Fig. 1.
Representative immunohistochemical images of vWF and CD45 in aortic samples. Top panel shows NA immunostained with anti-vWF. Middle panels show serial sections of an AAA sample immunostained for vWF and CD45. Bottom panels are serial sections of an AAA sample immunostained for vWF and CD45 showing leukocyte perivascular accumulation. Red arrows highlight specific immunostaining. In the middle panels, black arrows are used to orient the position of the vessel by indicating where the intima and adventitia are. Scale bars: 500 μm.
Fig. 2.
Fig. 2.
A: Expression levels of EC markers in NA (eNOS and VEGFR2, n = 17; vWF, n = 25) and AAA samples (vWF, n = 86; eNOS and VEGFR2, n = 60). Points without error bars indicate individual values and points at right are the mean ± SEM. *P < 0.05, ***P < 0.001 when compared with NA samples. B: Open points are the relative median values of mRNA levels of EC markers normalized to the highest median value in the stratified patient groups as a function the aortic diameter [NA, n = 25; LD (<55 mm), n = 14; MD (55–69.9 mm), n = 37; and HD (≥70 mm), n = 35], closed points are the mean ± SEM of the three EC markers (mean EC-M). *P < 0.05 compared with NA; #P < 0.05 when compared with the other patient groups. C: mRNA levels of leukocyte markers in NA (n = 25) and AAA (n = 86) samples; ***P < 0.001 when compared with NA samples. D: Open points are the relative median values of mRNA levels of leukocyte characteristic proteins normalized to the highest median value of the stratified patient groups; closed points are the mean ± SEM of the three leukocyte markers (mean L-M). *P < 0.05 compared with NA; #P < 0.05 when compared with the other patient groups.
Fig. 3.
Fig. 3.
A: Expression levels of COX isoenzymes and mPGES-1 in NA (n = 25) and AAA (n = 86) samples. Points without error bars indicate individual values and points at right are the mean ± SEM. *P < 0.05, *** P < 0.001 when compared with NA samples. B: Representative examples of immunohistochemistry for COX-2 and mPGES-1 in NA and AAA samples. Arrows indicate some immunostained cells in microvessels. ad, adventitia; med, media. Scale bars: 100 μm.
Fig. 4.
Fig. 4.
A: Plasma levels of PGE2 metabolites (PGE2M) in controls (Ctrols) (n = 39) and AAA (n = 39) (left), and production of PGE2M by NA (n = 15) and AAA samples (n = 32) (right). Points without error bars indicate individual values and points at right are the mean ± SEM. B: Relative median values of transcript levels of COX-1, COX-2, and mPGES-1 [NA, n = 25; LD (<55 mm), n = 14; MD (55–69.9 mm), n = 37; and HD (≥70 mm), n = 35] normalized to the highest median value of the stratified patient groups.*P < 0.05, **P < 0.01, ***P < 0.001 when compared with NA samples.
Fig. 5.
Fig. 5.
Transcript levels of PGE-receptors (EP) in NA (n = 25) and AAA (n = 86) samples. Points without error bars indicate individual values and points at right are the mean ± SEM. ***P < 0.001 when compared with NA samples.
Fig. 6.
Fig. 6.
Representative images of serial sections showing coexpression of EP-4 and mPGES-1 in microvessels of a NA and AAA samples. Arrows indicate some immunostained cells in microvessels and in leukocytes. Scale bars: 50 μm.
Fig. 7.
Fig. 7.
A: Immunofluorescent staining of MVECs in culture for EP-4 and mPGES-1 (upper panels), and double staining for EP-4 and mPGES-1 (bottom panels). B: Effect of EP-4 activation on in vitro angiogenesis. MVECs were seeded onto Matrigel in 96-well plates and exposed to 10 nmol/l of PGE2 or Cay10598 (an EP-4 agonist). AH23848 (200 nmol/l) was used to block EP-4. For IL-1β assays, cells were preincubated or not for 1 h with human recombinant IL-1β (50 U/ml) in the assay medium before being seeded in Matrigel. After 4 h of treatment, photographs (bottom) were taken and the number of closed polygons in the EC mesh was counted. Shaded bars are the mean ± SEM (expressed as relative to the corresponding controls). Inside the shaded bars in parentheses is the number of independent experiments performed in triplicate. Representative photographs are also shown (bottom panels). *P < 0.05, when compared with controls.

References

    1. Weintraub N. L. 2009. Understanding abdominal aortic aneurysm. N. Engl. J. Med. 361: 1114–1116 - PMC - PubMed
    1. Wahlgren C. M., Larsson E., Magnusson P. K. E., Hultgren R., Swadenborg J. 2010. Genetic and enviromental contributions to abdominal aortic aneurysm development in twin population. J. Vasc. Surg. 51: 3–7 - PubMed
    1. Choke E., Cockerill G., Wilson W. R., Sayed S., Dawson J., Loftus I., Thompson M. M. 2005. A review of biological factors implicated in abdominal aortic aneurysm rupture. Eur. J. Vasc. Endovasc. Surg. 30: 227–244 - PubMed
    1. Paik D. C., Fu C., Bhattacharya J., Tilson M. D. 2004. Ongoing angiogenesis in blood vessels of the abdominal aortic aneurysm. Exp. Mol. Med. 36: 524–533 - PubMed
    1. Choke E., Thompson M. M., Dawson J., Wilson W. R., Sayed S., Loftus I. M., Cockerill G. W. 2006. Abdominal aortic aneurysm rupture is associated with increased medial neovascularization and overexpression of proangiogenic cytokines. Arterioscler. Thromb. Vasc. Biol. 26: 2077–2082 - PubMed

Publication types

MeSH terms