. 2013 Oct 16;33(42):16698-714.
doi: 10.1523/JNEUROSCI.0187-13.2013.

Titration of Syntaxin1 in mammalian synapses reveals multiple roles in vesicle docking, priming, and release probability

Affiliations

Titration of Syntaxin1 in mammalian synapses reveals multiple roles in vesicle docking, priming, and release probability

Marife Arancillo et al. J Neurosci. .

Abstract

Synaptic vesicles undergo sequential steps in preparation for neurotransmitter release. Individual SNARE proteins and the SNARE complex itself have been implicated in these processes. However, discrete effects of SNARE proteins on synaptic function have been difficult to assess using complete loss-of-function approaches. We therefore used a genetic titration technique in cultured mouse hippocampal neurons to evaluate the contribution of the neuronal SNARE protein Syntaxin1 (Stx1) in vesicle docking, priming, and release probability. We generated graded reductions of total Stx1 levels by combining two approaches, namely, endogenous hypomorphic expression of the isoform Stx1B and RNAi-mediated knockdown. Proximity of synaptic vesicles to the active zone was not strongly affected. However, overall release efficiency of affected neurons was severely impaired, as demonstrated by a smaller readily releasable pool size, slower refilling rate of primed vesicles, and lower release probability. Interestingly, dose-response fitting of Stx1 levels against readily releasable pool size and vesicular release probability showed similar Kd (dissociation constant) values at 18% and 19% of wild-type Stx1, with cooperativity estimates of 3.4 and 2.5, respectively. This strongly suggests that priming and vesicle fusion share the same molecular stoichiometry, and are governed by highly related mechanisms.


Figures

Figure 1.
Figure 1.
Hypomorphic expression of a Stx1Byfp fusion knock-in allele. A, Cloning strategy for the Stx1Byfp fusion allele. Double asterisks denote a modified exon 7 described in Gerber et. al. (2008). B, Diagrams depicting the orientations of plasma membrane-anchored wild-type (top) and EYFP-fused Stx1B (bottom). C, RT-PCR amplification of a full ∼1.6 kb transcript encoded by the Stx1Byfp allele from Stx1B+/yfp mRNA. D, Immunoblot showing severely reduced levels of Stx1B–YFP in Stx1Byfp/yfp;Stx1A−/− embryonic brain lysates compared with lysates from control littermates. β-tubulin was used as a loading control. E, Immunofluorescent staining of hippocampal mass cultures for extracellularly localized YFP. Stx1Byfp/yfp, but not wild-type controls transduced with intracellular fluorescent protein, is positive for surface expression of YFP. Scale bar, 10 μm. F, Peroxidase immunostaining of Stx1B–YFP fusion protein in sagittal sections of P14 hippocampus and cerebellum. Antibodies to synaptotagmin 1 (Syn1) and Rab3A were used as positive controls, while PBS corresponds to negative control. DG, Dentate gyrus; MF, hippocampal mossy fiber synapse. G, Immunoblot showing expression levels of SNARE proteins, Munc18-1, and other synaptic proteins in wild-type, Stx1Byfp/yfp, and Stx1A−/− P14 mice. Valosin-containing protein (VCP) was used as a loading control. Asterisks mark proteins with significant changes in expression levels.
Figure 2.
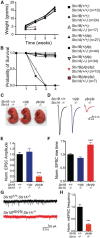
Figure 2.
Stx1Byfp/yfp;Stx1A−/− double mutants show premature lethality, gross morphological defects, and diminished Ca2+-evoked and spontaneous release. A, Weight curves for the Stx1Byfp mouse line. Stx1A+/+;Stx1Byfp/yfp and StxA+/−; Stx1Byfp/yfp show impaired growth and development before death at 3 weeks. B, Survival curves for the Stx1Byfp mouse line. Stx1A+/+;Stx1Byfp/yfp and Stx1A+/−;Stx1Byfp/yfp die postnatally after 3 weeks. Stx1A−/−;Stx1Byfp/yfp are not shown because they die at birth. C, Gross morphological abnormalities in Stx1Byfp/yfp;Stx1A−/− embryos compared with Stx1B+/yfp;Stx1A−/− and Stx1B+/+;Stx1A−/− littermates at E18.5. D, Sample traces of EPSCs from Stx1B+/+;Stx1A−/− (black), Stx1B+/yfp;Stx1A−/− (blue), and Stx1Byfp/yfp;Stx1A−/− (red) autaptic neurons. E, Normalized summary plot of EPSC peak amplitudes (***p < 0.0001). F, Normalized summary plot of EPSC rise times (***p < 0.0001). G, Sample traces of mEPSCs recorded at −70 mV from Stx1B+/+;Stx1A−/− (black) and Stx1Byfp/yfp;Stx1A−/− (red) neurons. H, Normalized summary plot of mEPSC frequency (***p < 0.0001).
Figure 3.
Figure 3.
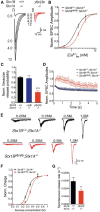
Stx1Byfp/yfp;Stx1A−/− double mutants have a smaller RRP of vesicles and slower RRP refilling rate. A, Sample traces of release induced by hyperosmotic stimulation from Stx1B+/+;Stx1A−/− (black), Stx1B+/yfp;Stx1A−/− (blue), and Stx1Byfp/yfp;Stx1A−/− (red) autaptic neurons. B, Normalized summary plot of RRP charge (***p < 0.0001). C, Refilling of the RRP as measured by paired applications of 0.5 m sucrose in Stx1B+/+;Stx1A−/− (black) and Stx1Byfp/yfp;Stx1A−/− (red). D, Fraction of the RRP refilled 2, 5, and 10 s after the first hyperosmotic stimulus (**p < 0.001).
Figure 4.
Figure 4.
Vesicle fusogenicity is impaired in Stx1Byfp/yfp;Stx1A−/− neurons. A, Sample traces of evoked responses from Stx1B+/+;Stx1A−/− (black) and Stx1Byfp/yfp;Stx1A−/− (red) neurons at different external Ca2+ concentrations. B, Ca2+ dose–response curves for Stx1B+/+;Stx1A−/− (black) and Stx1Byfp/yfp;Stx1A−/− (red) neurons. C, Normalized summary plot of Pvr, measured as the ratio of the EPSC charge and RRP charge, in Stx1B+/+;Stx1A−/− (black), Stx1B+/yfp;Stx1A−/− (blue), and Stx1Byfp/yfp;Stx1A−/− (red) neurons (***p < 0.0001). D, Short-term plasticity behavior during 10 Hz stimulation. E, Sample traces of release induced by different (hyperosmotic) sucrose concentrations. F, Dose–response curves from hypertonic sucrose stimulation. G, Spontaneous release rate, calculated as the fraction of the RRP released spontaneously per second (*p < 0.05).
Figure 5.
Figure 5.
Presynaptic Ca2+ influx is not altered in Stx1Byfp/yfp;Stx1A−/− neurons. A, Example baseline fluorescence (left; average of three images; F0) and peak 5 AP fluorescence (right; average two images; ΔF) for an Stx1Byfp/yfp;Stx1A−/− autaptic neuron. B, Average ΔF/F0 for ROIs selected from neuron shown in A (n = 41) in response to 2, 3, and 5 AP at 20 Hz. Arrow indicates initiation of stimulation. C, Average ΔF/F0 responses per cell for Stx1Byfp/yfp;Stx1A−/− (red; n = 35 cells) and control (black; Stx1B+/+;Stx1A−/− and Stx1B+/yfp;Stx1A−/− pooled; n = 33) for 2, 3, 5, and 10 AP at 20 Hz. D, E, Data were fitted with a linear regression analysis (red and black lines, respectively). Average paired-pulse ratio (D; 50 ms interstimulus interval; ***p < 0.0001) and EPSC amplitude (E; ***p < 0.0001) for Stx1Byfp/yfp;Stx1A−/− and control cells from C. All error bars represent SEM.
Figure 6.
Figure 6.
Knockdown of Stx1B–YFP further impaired release efficiency. A, Immunoblot showing knockdown of both Stx1B (in wild-type background), and Stx1B–YFP fusion protein (in Stx1Byfp/yfp;Stx1A−/− background), but not Stx1A, using a Stx1B sequence-specific shRNA. B, Sample traces of EPSCs from Stx1B+/+;Stx1A−/− (black), Stx1Byfp/yfp;Stx1A−/− untransduced (red), transduced with lentiviral vector only (Lois et al., 2002), and transduced with knock-down construct (purple). C, Sample traces of RRP released by hyperosmotic stimulation. D, Normalized summary plot of EPSC amplitudes (***p < 0.0001). E, Normalized summary plot of RRP charge (*p < 0.05, ***p < 0.001). F, Normalized summary plot of vesicular release probability. G, Short-term plasticity behavior during 10 Hz stimulation.
Figure 7.
Figure 7.
Knockdown of wild-type Stx1B phenocopied Stx1Byfp/yfp;Stx1A−/− hypomorphs. A, Sample traces of EPSCs from Stx1B+/+;Stx1A−/− neurons untransduced (black), transduced with lentiviral vector only (blue), or transduced with a Stx1B sequence-specific shRNA (green). B, Normalized summary plot of EPSC amplitudes (***p < 0.0001). C, Sample traces of RRP released by hyperosmotic stimulation. D, Normalized summary plot of RRP charge (***p < 0.0001). E, Normalized summary plot of vesicular release probability (**p < 0.001). F, Short-term plasticity behavior during 10 Hz stimulation. G, Sample images of autaptic neurons double labeled with the synaptic marker VGluT1 and the dendritic marker MAP2. Scale bar, 10 μm. H, Summary plot of synaptic vesicle density measured as VGluT1 puncta per 100 μm of dendrite length.
Figure 8.
Figure 8.
Lentiviral expression of either Stx1A or Stx1B, but not Munc18-1, rescues synaptic release in neurons with severe reduction in Stx1 levels. A–C, Normalized summary plots of EPSC peak amplitudes (A), RRP charge (B), and vesicular release probability (C) in control Stx1Byfp/yfp;Stx1A−/− neurons (black), and Stx1Byfp/yfp;Stx1A−/− neurons transduced without (red) or with Stx1A, Stx1B, or Munc18-1 rescue constructs (red outlines; ANOVA with Tukey's test, ***p < 0.001; n.s., not significant). D–F, Normalized summary plots of EPSC peak amplitudes (D), RRP charge (E), and vesicular release probability (F) in Stx1A−/− neurons without (black) or with shRNA-mediated knockdown of Stx1B (teal), and knockdown neurons transduced with Stx1A, Stx1B, or Munc18-1 rescue constructs (teal outlines; ANOVA with Tukey's test, *p < 0.05, ***p < 0.001; n.s., not significant).
Figure 9.
Figure 9.
Vesicle distance from the active zone upon reduction of Stx1 expression. A, Sample tomographic images of presynaptic nerve terminals from Stx1B+/+;Stx1A−/− neurons and Stx1Byfp/yfp;Stx1A−/− neurons that were untransduced and transduced with a Stx1B sequence-specific shRNA. Scale bar, 100 nm. B, Cumulative distribution of vesicle distance from the plasma membrane. C, Summary plot of vesicle distance within 40 nm of the plasma membrane. *p < 0.05. D, Summary plot of presynaptic area. E, Summary plot of total number of synaptic vesicles per synapse. **p < 0.001. F, Summary plot of synaptic vesicle density (ANOVA with Tukey's test, **p < 0.001). G, Summary plot of active zone length.
Figure 10.
Figure 10.
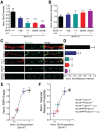
Priming and release probability as a function of Stx1 expression levels. A, Normalized summary plot of Stx1B fluorescence intensities. ***p < 0.0001. B, Normalized summary plot of Bassoon fluorescence intensities. C, Sample images from double labeling of autaptic neurons with anti-Stx1B and anti-Bassoon antibodies. Scale bar, 5 μm. D, Summary plot of Stx1B/Bassoon fluorescence intensity ratios measured within regions marked by Bassoon. E, F, Readily releasable pool size (E) and vesicular release probability (F), derived from previously shown data, were plotted as a function of normalized Stx1B expression levels (Stx1B+/+;Stx1A−/−, black; Stx1B+/yfp;Stx1A−/−, blue; Stx1B+/+;Stx1A−/− + k.d., teal; Stx1Byfp/yfp;Stx1A−/−, red; Stx1Byfp/yfp;Stx1A−/− + k.d., purple).

References

    1. Aguado F, Majó G, Ruiz-Montasell B, Llorens J, Marsal J, Blasi J. Syntaxin 1A and 1B display distinct distribution patterns in the rat peripheral nervous system. Neuroscience. 1999;88:437–446. doi: 10.1016/S0306-4522(98)00247-4. - DOI - PubMed
    1. Barg S, Knowles MK, Chen X, Midorikawa M, Almers W. Syntaxin clusters assemble reversibly at sites of secretory granules in live cells. Proc Natl Acad Sci U S A. 2010;107:20804–20809. doi: 10.1073/pnas.1014823107. - DOI - PMC - PubMed
    1. Basu J, Betz A, Brose N, Rosenmund C. Munc13–1 C1 domain activation lowers the energy barrier for synaptic vesicle fusion. J Neurosci. 2007;27:1200–1210. doi: 10.1523/JNEUROSCI.4908-06.2007. - DOI - PMC - PubMed
    1. Bennett MK, Calakos N, Scheller RH. Syntaxin: a synaptic protein implicated in docking of synaptic vesicles at presynaptic active zones. Science. 1992;257:255–259. doi: 10.1126/science.1321498. - DOI - PubMed
    1. Chao HT, Zoghbi HY, Rosenmund C. MeCP2 controls excitatory synaptic strength by regulating glutamatergic synapse number. Neuron. 2007;56:58–65. doi: 10.1016/j.neuron.2007.08.018. - DOI - PMC - PubMed

Publication types