. 2013 Oct 16;33(42):16796-804.
doi: 10.1523/JNEUROSCI.3146-13.2013.

Large-scale brain networks in the awake, truly resting marmoset monkey

Affiliations

Large-scale brain networks in the awake, truly resting marmoset monkey

Annabelle M Belcher et al. J Neurosci. .

Abstract

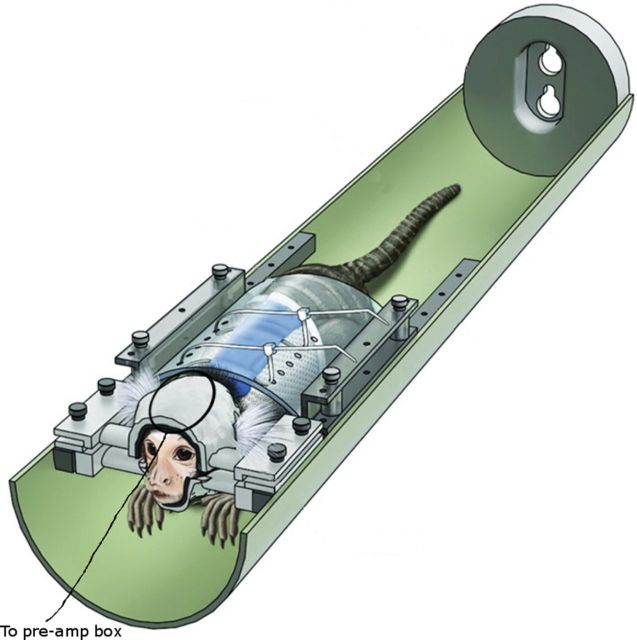
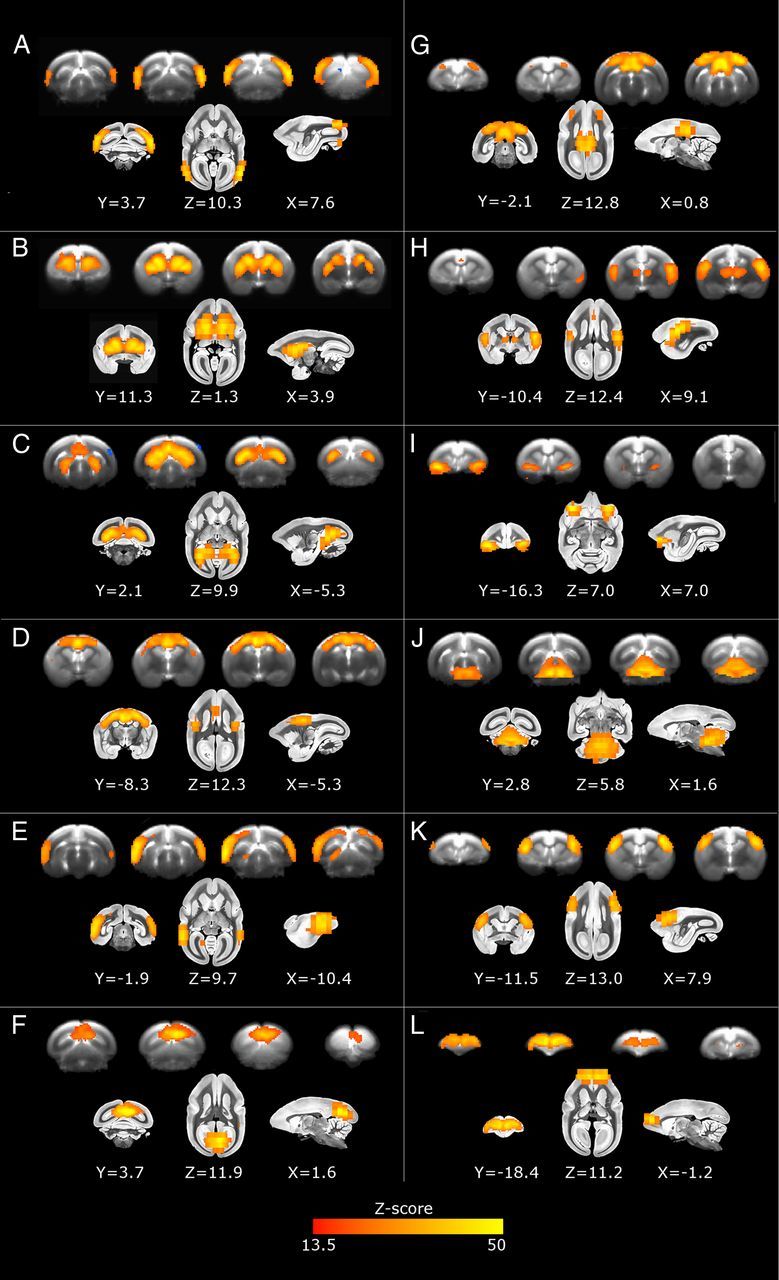
Resting-state functional MRI is a powerful tool that is increasingly used as a noninvasive method for investigating whole-brain circuitry and holds great potential as a possible diagnostic for disease. Despite this potential, few resting-state studies have used animal models (of which nonhuman primates represent our best opportunity of understanding complex human neuropsychiatric disease), and no work has characterized networks in awake, truly resting animals. Here we present results from a small New World monkey that allows for the characterization of resting-state networks in the awake state. Six adult common marmosets (Callithrix jacchus) were acclimated to light, comfortable restraint using individualized helmets. Following behavioral training, resting BOLD data were acquired during eight consecutive 10 min scans for each conscious subject. Group independent component analysis revealed 12 brain networks that overlap substantially with known anatomically constrained circuits seen in the awake human. Specifically, we found eight sensory and "lower-order" networks (four visual, two somatomotor, one cerebellar, and one caudate-putamen network), and four "higher-order" association networks (one default mode-like network, one orbitofrontal, one frontopolar, and one network resembling the human salience network). In addition to their functional relevance, these network patterns bear great correspondence to those previously described in awake humans. This first-of-its-kind report in an awake New World nonhuman primate provides a platform for mechanistic neurobiological examination for existing disease models established in the marmoset.


Figures

Figure 1.
Figure 1.
Illustration of a restrained marmoset in the MRI-compatible bed. A surface receive-only coil is placed directly on top of the customized helmet. Modified from Silva et al. (2011).
Figure 2.
Figure 2.
Twelve components identified as resting-state networks in the marmoset monkey (n = 6) using melodic group ICA. A–L, These networks (presented in the order in which they explain the signal variance) are labeled as follows: C1, a higher order visual network centered on V3, V4, A19 and A19DI (A); C2, basal ganglia (B); C3, primary visual (C); C4, dorsal (medial) somatomotor (D); C5, a higher-order visual network centered on V4, V5, V6, FST, and TE3 (E); C6, a higher-order midline visual network centered on V2, A19M, and V6(DM) (F); C7, retrosplenial and posterior cingulate cortex, medial parietal area PG, premotor and posterior parietal areas, and areas surrounding the intraparietal sulcus (G); C8, anterior cingulate, anterior insula, auditory cortex and thalamus (H); C9, orbitofrontal (I); C11, cerebellum (J); and C19, ventral somatomotor (K); and C20, frontal pole (L). Networks are shown in the four coronal slices deemed most representative of the correlation patterns on which network identification was based (top row, image generated as the average of the six monkeys' anatomical scans), and in coronal, axial, and sagittal planes on a high-resolution T2 marmoset anatomical image acquired in-house (bottom row). The color bar represents the z-score of these correlation patterns at a threshold of 13.5.
Figure 3.
Figure 3.
A basal ganglia component from an individual monkey's ICA, calculated from eight EPI sessions. The BOLD data are overlaid onto this individual monkey's own high-resolution T2 scan (top row), and onto a high-resolution T2 marmoset anatomical image acquired in-house (bottom row). For visualization purposes, the color bar represents the z-score of these correlation patterns at a threshold of 3.0.

References

    1. Abbott DH, Barnett DK, Colman RJ, Yamamoto ME, Schultz-Darken NJ. Aspects of common marmoset basic biology and life history important for biomedical research. Comp Med. 2003;53:339–350. - PubMed
    1. Agustín-Pavón C, Braesicke K, Shiba Y, Santangelo AM, Mikheenko Y, Cockroft G, Asma F, Clarke H, Man MS, Roberts AC. Lesions of ventrolateral prefrontal or anterior orbitofrontal cortex in primates heighten negative emotion. Biol Psychiatry. 2012;72:266–272. doi: 10.1016/j.biopsych.2012.03.007. - DOI - PubMed
    1. Anand A, Li Y, Wang Y, Wu J, Gao S, Bukhari L, Mathews VP, Kalnin A, Lowe MJ. Activity and connectivity of brain mood regulating circuit in depression: a functional magnetic resonance study. Biol Psychiatry. 2005;57:1079–1088. doi: 10.1016/j.biopsych.2005.02.021. - DOI - PubMed
    1. Baldassarre A, Lewis CM, Committeri G, Snyder AZ, Romani GL, Corbetta M. Individual variability in functional connectivity predicts performance of a perceptual task. Proc Natl Acad Sci U S A. 2012;109:3516–3521. doi: 10.1073/pnas.1113148109. - DOI - PMC - PubMed
    1. Beckmann CF, DeLuca M, Devlin JT, Smith SM. Investigations into resting-state connectivity using independent component analysis. Philos Trans R Soc Lond B Biol Sci. 2005;360:1001–1013. doi: 10.1098/rstb.2005.1634. - DOI - PMC - PubMed

Publication types