. 2013 Aug 19;8(8):e72638.
doi: 10.1371/journal.pone.0072638. eCollection 2013.

Ensemble of gene signatures identifies novel biomarkers in colorectal cancer activated through PPARγ and TNFα signaling

Affiliations

Ensemble of gene signatures identifies novel biomarkers in colorectal cancer activated through PPARγ and TNFα signaling

Stefano Maria Pagnotta et al. PLoS One. .

Abstract

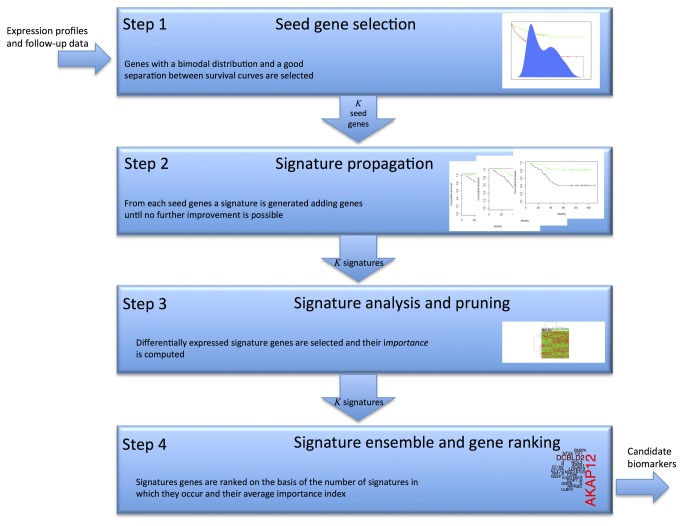
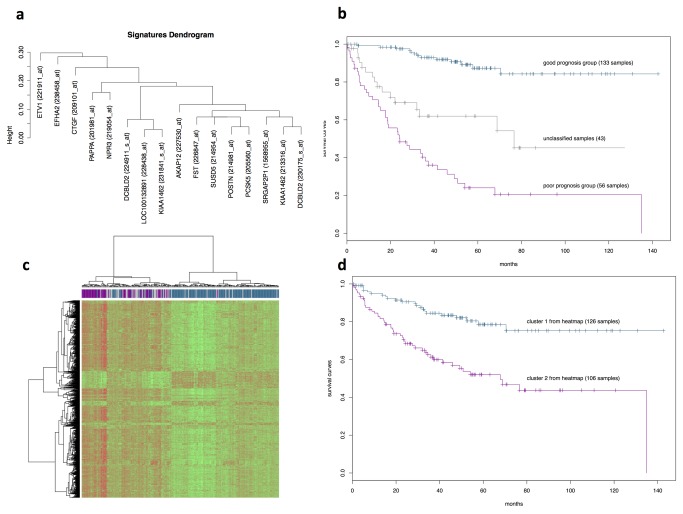
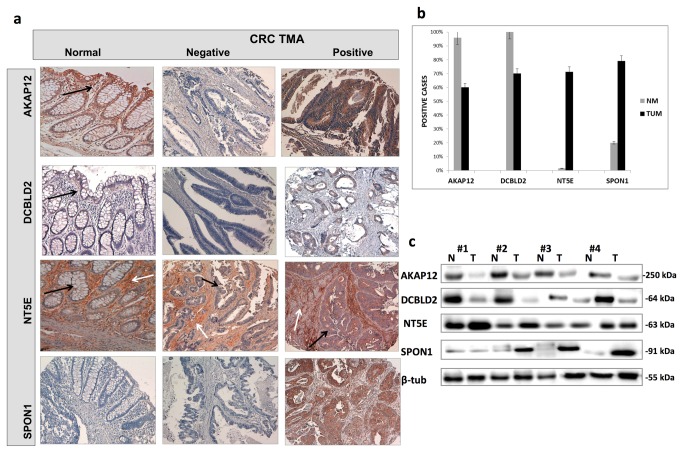
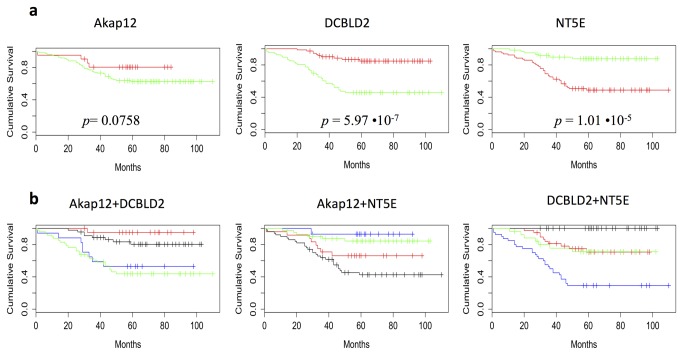
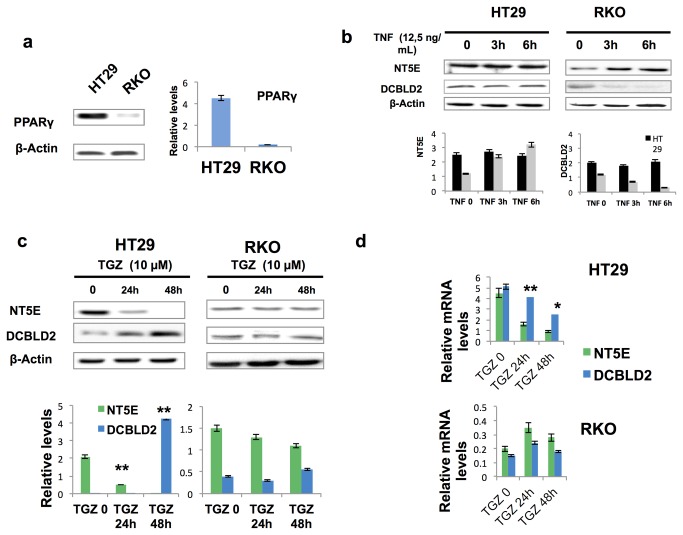
We describe a novel bioinformatic and translational pathology approach, gene Signature Finder Algorithm (gSFA) to identify biomarkers associated with Colorectal Cancer (CRC) survival. Here a robust set of CRC markers is selected by an ensemble method. By using a dataset of 232 gene expression profiles, gSFA discovers 16 highly significant small gene signatures. Analysis of dichotomies generated by the signatures results in a set of 133 samples stably classified in good prognosis group and 56 samples in poor prognosis group, whereas 43 remain unreliably classified. AKAP12, DCBLD2, NT5E and SPON1 are particularly represented in the signatures and selected for validation in vivo on two independent patients cohorts comprising 140 tumor tissues and 60 matched normal tissues. Their expression and regulatory programs are investigated in vitro. We show that the coupled expression of NT5E and DCBLD2 robustly stratifies our patients in two groups (one of which with 100% survival at five years). We show that NT5E is a target of the TNF-α signaling in vitro; the tumor suppressor PPARγ acts as a novel NT5E antagonist that positively and concomitantly regulates DCBLD2 in a cancer cell context-dependent manner.


Conflict of interest statement

Competing Interests: The authors have declared that no competing interests exist.

Figures

Figure 1
Figure 1. Outline of the gSFA procedure.
The gene Signature Finder Algorithm consists of 4 separate steps: (1) find candidate seed genes; (2) generate a signature starting from each seed gene; (3) prune the signatures by statistical inference; (4) integrate signatures by gene ranking.
Figure 2
Figure 2. Analysis of the signatures generated by gSFA.
a. Dendrogram of the dichotomies generated by each of the 16 gSFA signatures (Table 1 and Figure S1); b. Survival plot of the 133 samples stably classified in the good prognosis group, 56 samples in the poor prognosis group and 43 uncertain samples (log-rank test gives p < 10--16); c. heatmap of DEGs between the two stable groups, Red indicates overexpressed genes (expression levels over the median) and green indicates underexpressed genes (expression levels under the median); d. survival curves samples in the two clusters of the heatmap as in c. (p = 6.6 ·10-6).
Figure 3
Figure 3. TMAs and western blot validation analysis of AKAP12, DCBLD2, NT5E and SPON1.
a. “Columns from left to right” indicate immunostaining pattern in normal colonic samples and CRC cores negative and positive for each marker AKAP12, DCBLD2, NT5E, SPON1. Black arrows indicate immunohistochemical staining pattern in normal or malignant colonic cells. White arrows indicate the immunostaining distribution in the stromal compartment (endothelial, regulatory T-cells and macrophages) characteristic of NT5E expression pattern. Magnification 10X; b. Number of positive cases detected on TMA validation series comprising tumor specimens (TUM) and a subgroup of matched normal colonic mucosa (NM). Error bars indicate the standard deviation from the mean (p < 0.05); c. Four representative frozen CRC specimens (T) and matched normal mucosa (N) were identified in the same cohort of patients and analyzed by immunoblot. Molecular weight markers are indicated in kilodaltons. β-tubulin was used as loading control to normalize band intensities.
Figure 4
Figure 4. Survival curves of our cohort as function of the selected genes.
a. Survival curves on our CRC validation series, categorized as having high (red curve) and low (green curve) AKAP12, DCBLD2 and NT5E expression. p-value for the null hypothesis of equal population survival curves is provided by log-rank test in each graph; b. Survival curves estimated combining the expression (high and low) of all 3 markers (AKAP12, DLBLC2, NTE5). Red curve represents the combination high/high; the blue curve represents the combination high/low; the black curve represents the combination low/high; the green curve represents the combination low/low.
Figure 5
Figure 5. Cross-talk between TNF-α and PPARγ signaling regulates DCBLD2 and NT5E intracellular levels in CRC cell lines.
a. Western blotting analysis shows PPARγ expression in HT29 and RKO CRC derived cell lines, as a model to investigate variations of NTE5 levels in response to TNF-α treatment. b. PPARγ-dependent protein induction of NT5E by TNF-α in CRC cells treated with 12,5 ng/ml TNF-α at different time points and analyzed by western blotting. c and d. Time course of NT5E and DLBLC2 mRNA and protein regulation by troglitazone (TGZ), a PPARγ agonist, in the same cells. β-actin and Glyceraldehyde-3-phosphate dehydrogenase (GAPDH) were used as control to normalize expression levels in Western blotting and Real-time RT-PCR analysis. The results are expressed as means ±S.D. of three independent experiments. * p < 0.05, **p < 0.01.

References

    1. Ferlay J, Shin HR, Bray F, Forman D, Mathers C et al. (2010) Estimates of worldwide burden of cancer in 2008: GLOBOCAN 2008. J Cancer 127: 2893-2917. PubMed: 21351269. - PubMed
    1. Agesen TH, Sveen A, Merok MA, Lind GE, Nesbakken A et al. (2012) ColoGuideEx: a robust gene classifier specific for stage II colorectal cancer prognosis. Gut 61: 1560–1567. doi:10.1136/gutjnl-2011-301179. PubMed: 22213796. - DOI - PubMed
    1. Cancer Genome Atlas Network (2012). Comprehensive Molecular Characterization of Human Colon and Rectal Cancer. Nature 487: 330–337
    1. Culhane AC, Schröder MS, Sultana R, Picard SC, Martinelli EN et al. (2012) GeneSigDB—a curated database of gene expression signatures. Nucleic Acids Res 40(D1): D1060-D1066. doi:10.1093/nar/gkr901. - DOI - PMC - PubMed
    1. Chen HY, Yu SL, Chen CH, Chang GC, Chen CY et al. (2007) A Five-Gene Signature and Clinical Outcome in Non–Small-Cell Lung Cancer. N Engl J Med 356: 11–20. doi:10.1056/NEJMicm064050. PubMed: 17202451. - DOI - PubMed

Publication types

MeSH terms