

Optimization and partial characterization of culture conditions for the production of alkaline protease from Bacillus licheniformis P003
- PMID: 24133650
- PMCID: PMC3795880
- DOI: 10.1186/2193-1801-2-506
Optimization and partial characterization of culture conditions for the production of alkaline protease from Bacillus licheniformis P003
Abstract
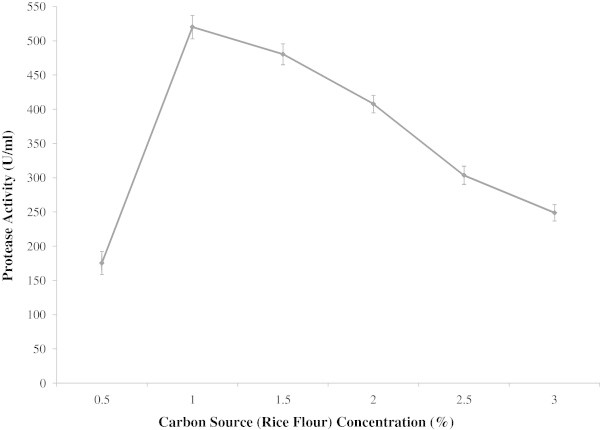
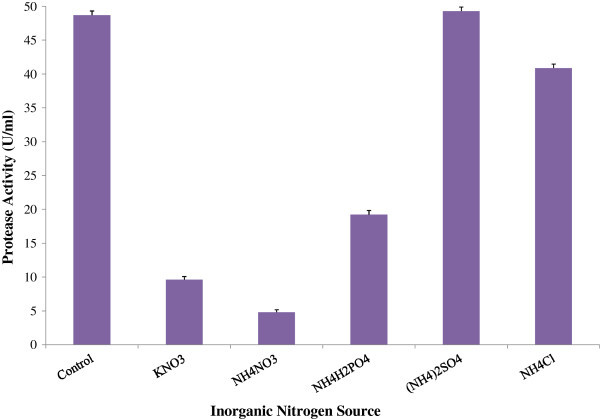
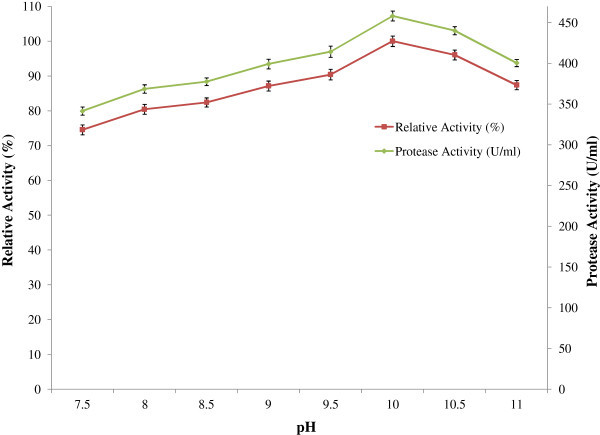
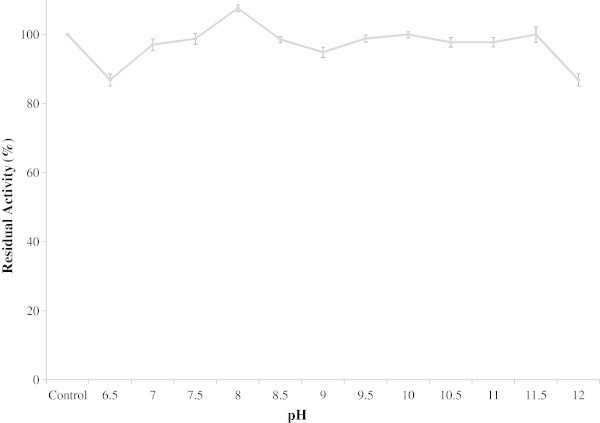
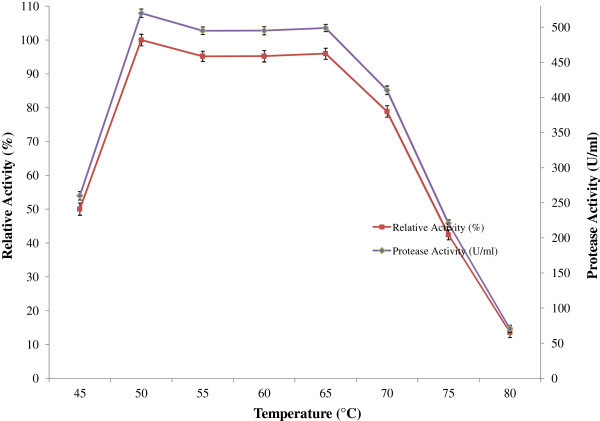
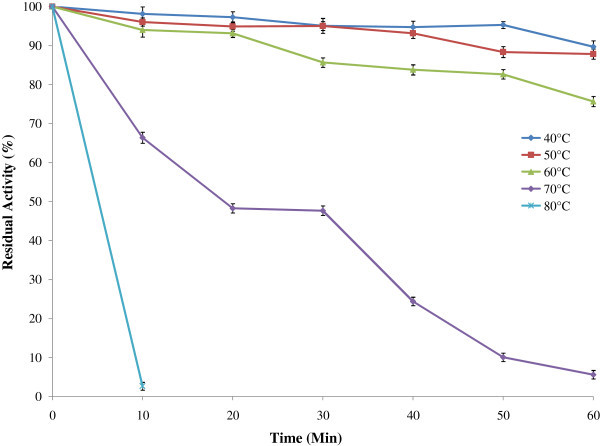
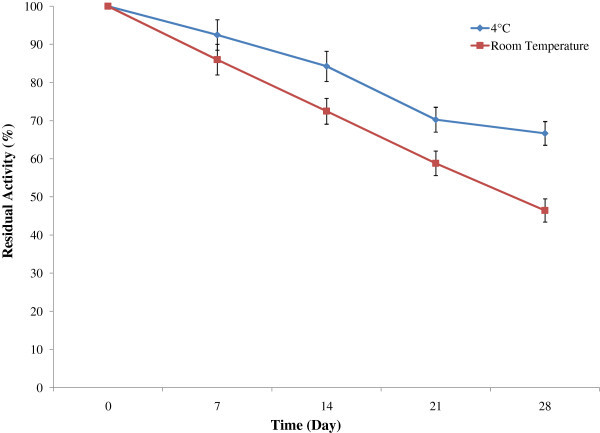
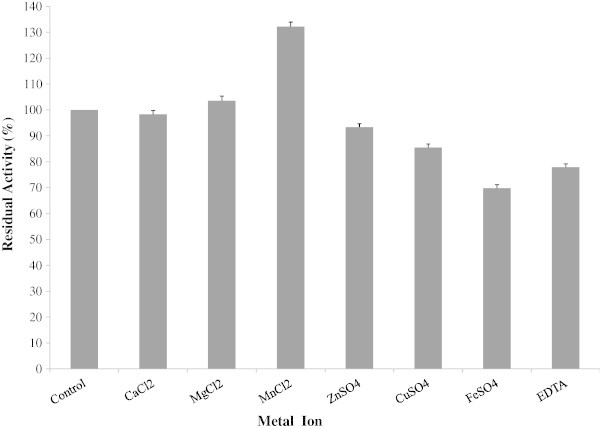
Proteolytic enzymes have occupied a pivotal position for their practical applications. The present study was carried out under shake flask conditions for the production of alkaline protease from Bacillus licheniformis P003 in basal medium containing glucose, peptone, K2HPO4, MgSO4 and Na2CO3 at pH 10. The effect of culture conditions and medium components for maximum production of alkaline protease was investigated using one factor constant at a time method along with its characterization. Maximum level of enzyme production was obtained after 48h of incubation with 2% inoculum size at 42°C, under continuous agitation at 150 rpm, in growth medium of pH 9. Highest enzyme production was obtained using 1% rice flour as carbon source and 0.8% beef extract as organic nitrogen source. Results indicated that single organic nitrogen source alone was more suitable than using in combinations and there was no significant positive effect of adding inorganic nitrogen sources in basal medium. After optimization of the parameters, enzyme production was increased about 20 fold than that of in basal medium. The crude enzyme was highly active at pH 10 and stable from pH 7-11. The enzyme showed highest activity (100%) at 50°C, and retained 78% relative activity at 70°C. Stability studies showed that the enzyme retained 75% of its initial activity after heating at 60°C for 1h. The enzyme retained about 66% and 46% of its initial activity after 28 days of storage at 4°C and room temperature (25°C) respectively. Mn(2+) and Mg(2+) increased the residual activity of the enzyme, whereas Fe(2+) moderately inhibited its residual activity. When pre-incubated with Tween-20, Tween-80, SDS and H2O2, each at 0.5% concentration, the enzyme showed increased residual activity. These characteristics may make the enzyme suitable for several industrial applications, especially in leather industries.
Keywords: Alkaline protease; Bacillus licheniformis; Production optimization; Shake flask culture.
Figures
Similar articles
-
Production and partial characterization of extracellular amylase enzyme from Bacillus amyloliquefaciens P-001.Springerplus. 2013 Apr 10;2(1):154. doi: 10.1186/2193-1801-2-154. Print 2013 Dec. Springerplus. 2013. PMID: 23626928 Free PMC article.
-
Stable protease from Bacillus licheniformis-MA1 strain: statistical production optimization, kinetic and thermodynamic characterization, and application in silver recovery from used X-ray films.Microb Cell Fact. 2025 May 5;24(1):98. doi: 10.1186/s12934-025-02706-z. Microb Cell Fact. 2025. PMID: 40325442 Free PMC article.
-
Optimization of novel and greener approach for the coproduction of uricase and alkaline protease in Bacillus licheniformis by Box-Behnken model.Prep Biochem Biotechnol. 2018 Jan 2;48(1):24-33. doi: 10.1080/10826068.2017.1381623. Epub 2017 Nov 20. Prep Biochem Biotechnol. 2018. PMID: 28976246
-
Production and partial characterization of dehairing alkaline protease from Bacillus subtilis AKAL7 and Exiguobacterium indicum AKAL11 by using organic municipal solid wastes.Heliyon. 2018 Jun 7;4(6):e00646. doi: 10.1016/j.heliyon.2018.e00646. eCollection 2018 Jun. Heliyon. 2018. PMID: 30009270 Free PMC article.
-
Optimization of culture conditions for the production of haloalkaliphilic thermostable protease from an extremely halophilic archaeon Halogeometricum sp. TSS101.Lett Appl Microbiol. 2006 Oct;43(4):385-91. doi: 10.1111/j.1472-765X.2006.01980.x. Lett Appl Microbiol. 2006. PMID: 16965368
Cited by
-
Extremozymes and compatible solute production potential of halophilic and halotolerant bacteria isolated from crop rhizospheric soils of Southwest Saurashtra Gujarat.Sci Rep. 2024 Jul 8;14(1):15704. doi: 10.1038/s41598-024-63581-z. Sci Rep. 2024. PMID: 38977706 Free PMC article.
-
Production and Characterization of a Bioflocculant from Pichia kudriavzevii MH545928.1 and Its Application in Wastewater Treatment.Int J Environ Res Public Health. 2022 Mar 8;19(6):3148. doi: 10.3390/ijerph19063148. Int J Environ Res Public Health. 2022. PMID: 35328836 Free PMC article.
-
Purification and Characterization of a Novel Extracellular Haloprotease Vpr from Bacillus licheniformis Strain KB111.Food Technol Biotechnol. 2022 Jun;60(2):225-236. doi: 10.17113/ftb.60.02.22.7301. Food Technol Biotechnol. 2022. PMID: 35910276 Free PMC article.
-
Enhanced catalytic activity of Bacillus aryabhattai P1 protease by modulation with nanoactivator.Heliyon. 2020 Jun 4;6(6):e04053. doi: 10.1016/j.heliyon.2020.e04053. eCollection 2020 Jun. Heliyon. 2020. PMID: 32529068 Free PMC article.
-
Genetic Tools and Techniques for Recombinant Expression in Thermophilic Bacillaceae.Microorganisms. 2018 May 10;6(2):42. doi: 10.3390/microorganisms6020042. Microorganisms. 2018. PMID: 29748477 Free PMC article. Review.
References
-
- Akcan N. Production of extracellular protease in submerged fermentation by Bacillus licheniformis ATCC 12759. Afr J Biotechnol. 2012;11(7):1729–1735.
-
- Beg QK, Saxena RK, Gupta R. De-repression and subsequent induction of protease synthesis by Bacillus mojavensis under fed-batch operations. Process Biochem. 2002;37(10):1103–1109. doi: 10.1016/S0032-9592(01)00320-X. - DOI
-
- Bhunia B, Dutta D, Chaudhuri S. Selection of suitable carbon, nitrogen and sulphate source for the production of alkaline protease by Bacillus licheniformis NCIM-2042. Not Sci Biol. 2010;2(2):56–59.
LinkOut - more resources
Full Text Sources
Other Literature Sources
