. 2013 Nov 26;7(11):10362-70.
doi: 10.1021/nn404782p. Epub 2013 Oct 24.

Near-infrared fluorescence energy transfer imaging of nanoparticle accumulation and dissociation kinetics in tumor-bearing mice

Affiliations

Near-infrared fluorescence energy transfer imaging of nanoparticle accumulation and dissociation kinetics in tumor-bearing mice

Yiming Zhao et al. ACS Nano. .

Abstract

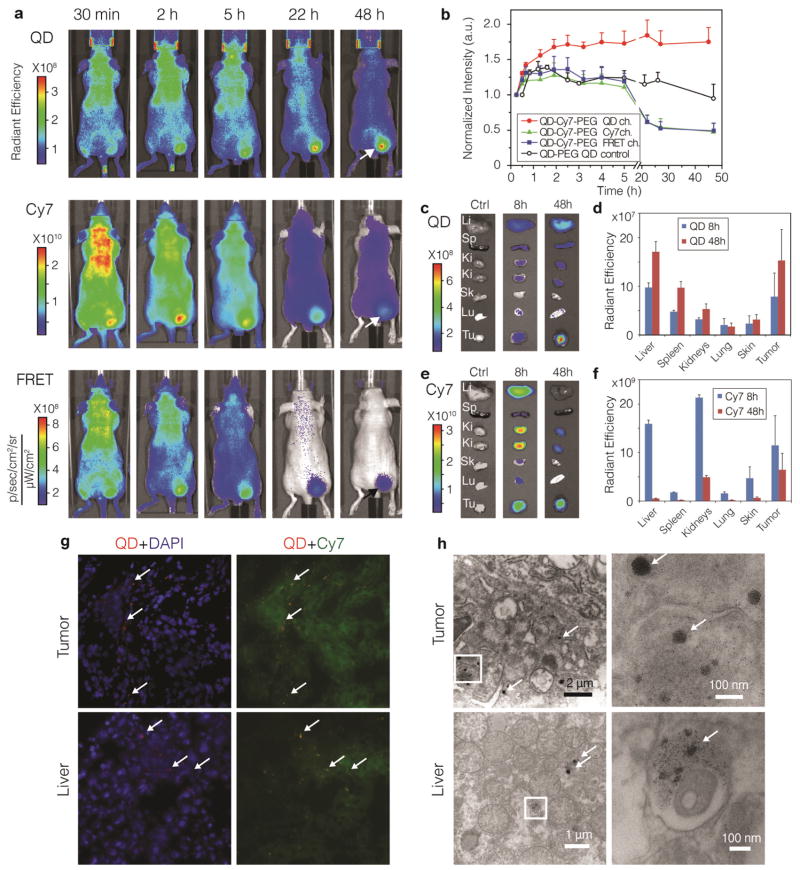
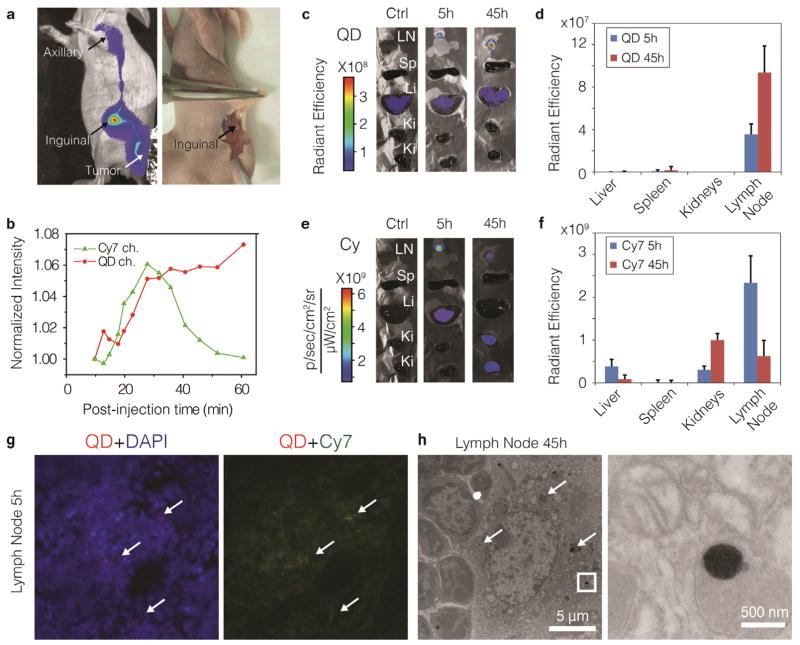
In the current study we show the dissociation and tumor accumulation dynamics of dual-labeled near-infrared quantum dot core self-assembled lipidic nanoparticles (SALNPs) in a mouse model upon intravenous administration. Using advanced in vivo fluorescence energy transfer imaging techniques, we observed swift exchange with plasma protein components in the blood and progressive SALNP dissociation and subsequent trafficking of individual SALNP components following tumor accumulation. Our results suggest that upon intravenous administration SALNPs quickly transform, which may affect their functionality. The presented technology provides a modular in vivo tool to visualize SALNP behavior in real time and may contribute to improving the therapeutic outcome or molecular imaging signature of SALNPs.


Figures

Figure 1
Figure 1. Schematic of nanoparticle trafficking and fate upon intravenous administration
a, Schematic illustration of the blood circulation, dissociation dynamics, tumor accumulation, and trafficking of self-assembled nanoparticles upon intravenous administration(I) in a tumor-bearing mouse. Several distinct compartments include the blood (II), the tumor (IV, interstitium), lymphatics and lymph nodes (V), and clearance organs of the mononuclear phagocyte system (III). b, Schematic structure of a self-assembled lipid-nanoparticle that consists of a near infrared quantum dot core covered by a self-assembled lipid-coating that is composed of Cy7-labeled and PEGylated lipids (QD710-Cy7-PEG). c, TEM images of QD710-Cy7-PEG with (lower) and without negative staining (upper). Both scale bars are 20 nm. d, Emission spectra of QD710-Cy7-PEG nanoparticles in PBS with different percentages of Cy7-lipids in the lipid corona. λExc = 500 nm. At increasing content of Cy7-lipids, the QD emission decreased dramatically, while Cy7 emission increased correspondingly, confirming the occurrence of FRET from the QD cores to the Cy7 dyes in the corona.
Figure 2
Figure 2. Accumulation and dissociation of QD710-Cy7-PEG in xenograft tumor mouse model upon intravenous administration
a, Representative in vivo NIR fluorescence images of a tumor bearing mouse injected with 100 pmol/g FRET particles QD710-Cy7-PEG at 30 min, and 2, 5, 22, and 48 h post-injection. Tumor mice injected with 100 pmol/g QD710-PEG nanoparticles containing no Cy7-lipids were used as QD control. Fluorescent signal was collected using three optical filters settings: QD (λExc = 605 ± 18 nm, λEm = 720 ± 10 nm), Cy7 (λExc =745± 18 nm, λEm = 800 ± 10 nm) and FRET (λExc= 605± 18 nm, λEm= 800 ± 10 nm). b. The mean intensities (n=5 mice per group) from the tumor area (indicatad with arrows in a) plotted against post-injection time. QD, Cy7 and FRET intensities were from mice injected with QD710-Cy7-PEG, and QD control were from mice injected with QD710-PEG. Mice were sacrificed at 8 h (n = 3) and 48 h (n = 5) after injection and major organs were subjected to ex vivo fluorescence imaging. Representative images and mean intensities from the organs are presented in c and d for the QD channel and in e and f for the Cy7 channel. Li, liver; Sp, spleen; Ki, kidney; Sk, skin; Lu, lung; Tu, tumor. g, Fluorescence microscopy images of frozen sections of tumor (upper row) and liver (lower row) tissue sections at 48 h post-injection. Signal from QD (λExc = 620 ± 30 nm, λEm= 700 ± 35 nm) is red, DAPI for nucleus staining (λExc = 350 ± 30 nm, λEm= 460 ± 22 nm) is blue and Cy7 (λExc =710 ± 35 nm, λEm= 810 ± 40 nm) is green. Aggregates of QD cores are indicated by arrows. h, Stained transmission electron microscopy (TEM) images of tumor (upper row) and liver (lower row) tissues at 48 h after injection. Insets are magnified on the right. Aggregates of QD cores are indicated by arrows.
Figure 3
Figure 3. Intravital microscopy of tumors grown in a window chamber and FPLC investigation of the dynamics of lipid-coated nanocrystal
a, Mice with tumor grown in a window chamber were injected with 130 pmol/g QD610-Cy5.5-PEG and continuously observed for 2 h, and discretely observed until 48 h post administration. Representative fluorescence images at 30 min, 2 h and 48 h are shown in a. The scale bar represents 100 μm. Four optical channels were used: QD (λExc = 488 nm, λEm= 612–655 nm) is shown in red, Cy5.5 (λExc = 633 nm, λEm= 698–719 nm) is shown in green, FRET (λExc = 488 nm, λEm= 698–719 nm) in cyan and HOECHST for nucleus staining (λExc = 780 nm, λEm= 435–485 nm) in blue. The normalized fluorescence intensities in three channels (QD in filled circles, Cy5.5 in filled triangles and FRET in filled square) are plotted against post-injection time for the vascular in b, and for extravascular space in c. QD610-PEG nanoparticles containing non Cy5.5-lipids were used as QD control (empty circles). d, The FRET/QD intensity ratios derived from the graphs in b, c represent the relative extent of FRET per QD and are plotted against time. Plasma collected from mice at 2 h, 8 h and 48 h after injected with 100 pm/g QD-Cy5.5-PEG (n=3 animals for each time point) separated in different fractions using fast protein liquid chromatography (FPLC). The total fluorescent intensities from four different protein fractions: VLDL (25–90 nm), LDL (18–25 nm), HDL (5–15 nm) and small plasma proteins (< 5 nm) are summarized in e, for QD signal (λExc = 430 ± 18 nm, λEm= 620 ± 10 nm), and in f, for Cy5.5 signal (λExc = 640 ± 18 nm, λEm= 700 ± 10 nm).
Figure 4
Figure 4. Peri-tumoral administration of lipid-coated nanocrystals
a, NIR fluorescence image (left, laid over bright field image) show in both the QD and the Cy7 channel (Cy7 channel shown here), that the QD710-Cy7-PEG migrated through lymphatic draining from the periphery of the tumor to the inguinal node (as sentinel lymph node (SLN)) and further to the axillary node. After re-injection with 1% Evans blue, QD710-Cy7-PEG and Evans blue were found co-localized in the same lymph node, as indicated by the arrows (a, right, color image). b, Normalized total fluorescent intensities of QD710 (squares) and Cy7 (triangles) from the SLN are plotted against post-injection time, showing their different dynamic behaviours. Mice were sacrificed at 5 h and 45 h post-injection time (n=3 for each time point). Subsequently, the inguinal node and major organs were subject to ex vivo fluorescence imaging. Representative images and mean intensities are depicted in c and d for the QD channel and in e and f for the Cy7 channel. LN, lymph node. g, Fluorescence microscopy images of SLN tissue at 5 h post-injection. Merged images are shown with signal from QD (red), Cy7 (green) and DAPI (blue). Spots of QD accumulates are indicated with arrows. h, TEM images of SLN tissues at 45h after injection. Aggregates of QD cores inside the phagocyte are indicated by arrows. Insets are enhanced on the right.

References

    1. Mulder WJM, Strijkers GJ, van Tilborg GAF, Cormode DP, Fayad ZA, Nicolay K. Nanoparticulate Assemblies of Amphiphiles and Diagnostically Active Materials for Multimodality Imaging. Acc Chem Res. 2009;42:904–914. - PMC - PubMed
    1. Shi J, Xiao Z, Kamaly N, Farokhzad OC. Self-Assembled Targeted Nanoparticles: Evolution of Technologies and Bench to Bedside Translation. Acc Chem Res. 2011;44:1123–1134. - PubMed
    1. Yoo JW, Irvine DJ, Discher DE, Mitragotri S. Bio-Inspired, Bioengineered and Biomimetic Drug Delivery Carriers. Nat Rev Drug Discov. 2011;10:521–535. - PubMed
    1. Whitehead KA, Langer R, Anderson DG. Knocking Down Barriers: Advances in siRNA Delivery. Nat Rev Drug Discov. 2009;8:129–38. - PMC - PubMed
    1. Peer D, Karp JM, Hong S, Farokhzad OC, Margalit R, Langer R. Nanocarriers as an Emerging Platform for Cancer Therapy. Nat Nanotechnol. 2007;2:751–760. - PubMed

Publication types

LinkOut - more resources