Review
. 2015 Jan;79(1):56-71.
doi: 10.1111/bcp.12258.

Population pharmacokinetic-pharmacodynamic modelling in oncology: a tool for predicting clinical response

Affiliations
Review

Population pharmacokinetic-pharmacodynamic modelling in oncology: a tool for predicting clinical response

Brendan C Bender et al. Br J Clin Pharmacol. 2015 Jan.

Abstract

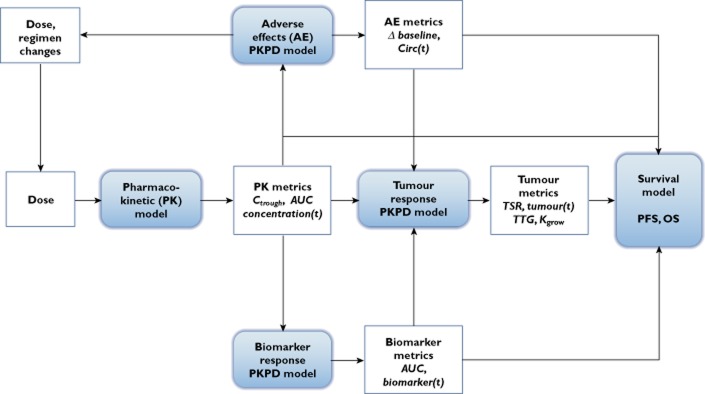
In oncology trials, overall survival (OS) is considered the most reliable and preferred endpoint to evaluate the benefit of drug treatment. Other relevant variables are also collected from patients for a given drug and its indication, and it is important to characterize the dynamic effects and links between these variables in order to improve the speed and efficiency of clinical oncology drug development. However, the drug-induced effects and causal relationships are often difficult to interpret because of temporal differences. To address this, population pharmacokinetic-pharmacodynamic (PKPD) modelling and parametric time-to-event (TTE) models are becoming more frequently applied. Population PKPD and TTE models allow for exploration towards describing the data, understanding the disease and drug action over time, investigating relevance of biomarkers, quantifying patient variability and in designing successful trials. In addition, development of models characterizing both desired and adverse effects in a modelling framework support exploration of risk-benefit of different dosing schedules. In this review, we have summarized population PKPD modelling analyses describing tumour, tumour marker and biomarker responses, as well as adverse effects, from anticancer drug treatment data. Various model-based metrics used to drive PD response and predict OS for oncology drugs and their indications are also discussed.

Keywords: PKPD; biomarkers; oncology; population modelling; time-to-event; tumour.


Figures

Figure 1
Figure 1
Model-based framework for clinical oncology drug development. From development of a population PK model, PK metrics can be implemented into PKPD models for various responses, i.e. adverse effects, tumour and biomarker responses, and also assessed as predictors for survival. PKPD models can support dose and regimen changes, as well as provide model-based metrics that can be assessed as drivers for other PD responses and as predictors for survival. Δ baseline: change from baseline; AUC: area under the curve; biomarker(t): biomarker time course; Circ(t): circulating blood cell (e.g. platelets, neutrophils) time course; Concentration(t): Drug concentration–time course; Ctrough: drug trough concentrations; Kgrow: tumour growth rate constant parameter; OS: overall survival; PFS: progression-free survival; PKPD: pharmacokinetic-pharmacodynamic; Tumour(t): tumour time course; TSR: tumour size ratio; TTG: time to tumour growth
Figure 2
Figure 2
TGI model structure and representative plot. (A) Compartmental representation of the TGI model. Kgrow: tumour growth rate constant; Exposure: drug exposure metric; K: drug exposure elimination rate constant; Kkill: tumour kill rate constant; λ: drug resistance parameter. Kgrow, Kkill, and λ are model parameters to be estimated. K describes drug elimination in cases where the PKPD driver is dynamic and may be estimated or fixed based on the drug elimination half-life; the K parameter was not in the original publication [23] (i.e. K = 0), but can be applied to characterize reduction in exposure. (B) TGI model-predicted tumour SLD (red curve) and drug effect (blue curve) time courses for a once every 3 week (q3w) drug treatment. TSR: tumour size ratio from baseline, typically assessed after 1 or 2 treatment cycles (6–8 weeks); TTG: time to tumour growth. TSR, TTG, Kgrow, and tumour SLD time course are metrics that can be assessed as predictors for survival
Figure 3
Figure 3
IDR model structure and representative plot. (A) Compartmental representation of the IDR models and associated equations. E: drug exposure; R: biomarker response; Kin: zero order rate constant for production of response; Kout: first order rate constant for loss of the response. The drug effect is exemplified by an Emax model where Imax or Smax are maximal fractional ability of drug to inhibit or stimulate, respectively and IC50 or SC50, are exposures that produces 50% of maximum inhibition or stimulation, respectively. Kin, Kout, IC50 (or SC50), and Imax (or Smax) are model parameters to be estimated. (B) IDR model-predicted biomarker time courses for inhibition of Kin (IDR I, solid red curve) and inhibition of Kout (IDR II, dashed red curve) and drug effect time course (blue curve) for a 4 day constant rate drug input with 2 day washout interval
Figure 4
Figure 4
Myelosuppression model structure and representative plot. (A) Compartmental representation of the of the myelosuppression model. Prol: proliferation cell pool compartment; T1, T2 and T3: transit compartments; Circ: blood circulation compartment; Drug effect: slope•exposure; Exposure:, e.g. the drug–concentration time course; Slope: drug inhibition constant; Circ0: baseline neutrophil count; γ: feedback term; MTT: mean transit time, derived as Ktr/(n + 1), where n is the number of transit compartments. Slope, MTT, Circ0 and γ are model parameters to be estimated. (B) Myelosuppression model-predicted neutrophil (red curve) and drug effect (blue curve) time courses for a once every 3 weeks drug treatment. Δ baseline may be calculated from the model-predicted (baseline-nadir)/baseline

References

    1. Siegel R, Naishadham D, Jemal A. Cancer statistics, 2012. CA Cancer J Clin. 2012;62:10–29. - PubMed
    1. Kummar S, Gutierrez M, Doroshow JH, Murgo AJ. Drug development in oncology: classical cytotoxics and molecularly targeted agents. Br J Clin Pharmacol. 2006;62:15–26. - PMC - PubMed
    1. FDA. 2007. Guidance for industry. Clinical trial endpoints for the approval of cancer drugs and biologics. Available at http://www.fda.gov/downloads/Drugs/GuidanceComplianceRegulatoryInformati... (last accessed 7 November 2013)
    1. Booth CM, Eisenhauer EA. Progression-free survival: meaningful or simply measurable? J Clin Oncol. 2012;30:1030–1033. - PubMed
    1. Bruno R, Claret L. On the use of change in tumor size to predict survival in clinical oncology studies: toward a new paradigm to design and evaluate phase II studies. Clin Pharmacol Ther. 2009;86:136–138. - PubMed

Publication types

LinkOut - more resources