. 2014 Jan;39(1):107-23.
doi: 10.1111/ejn.12389. Epub 2013 Oct 18.

The origin of projections from the posterior cingulate and retrosplenial cortices to the anterior, medial dorsal and laterodorsal thalamic nuclei of macaque monkeys

Affiliations

The origin of projections from the posterior cingulate and retrosplenial cortices to the anterior, medial dorsal and laterodorsal thalamic nuclei of macaque monkeys

John P Aggleton et al. Eur J Neurosci. 2014 Jan.

Abstract

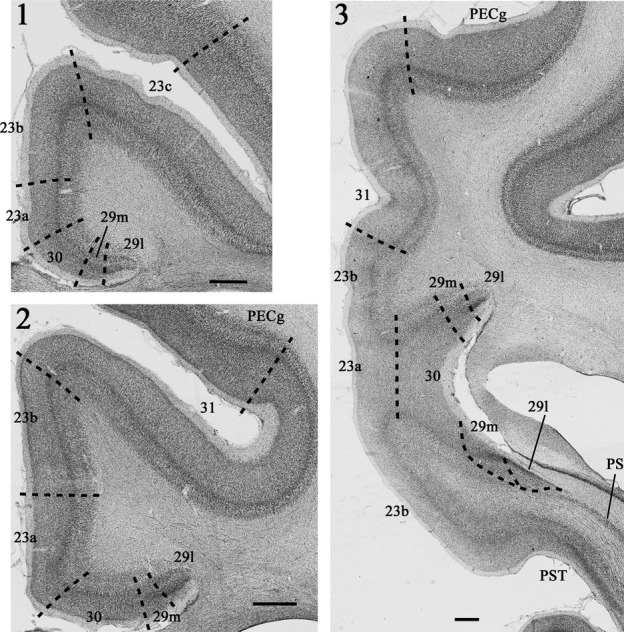
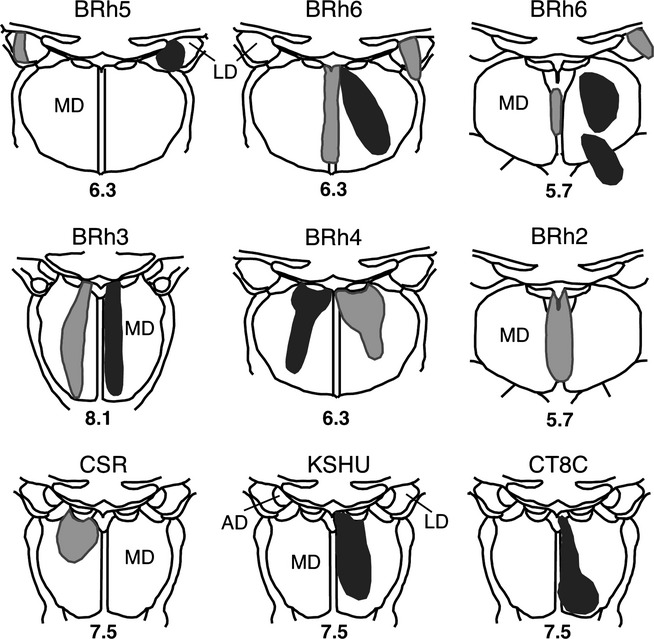
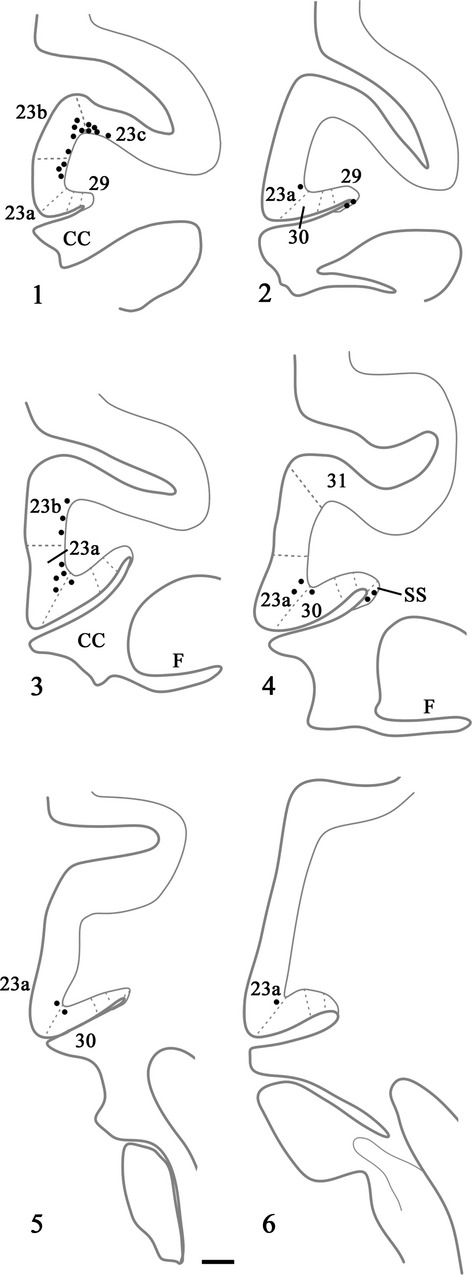
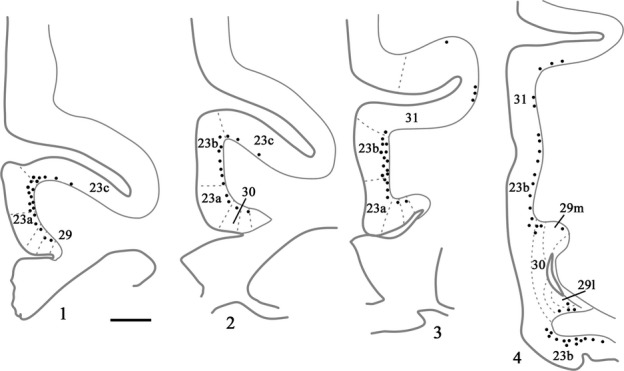
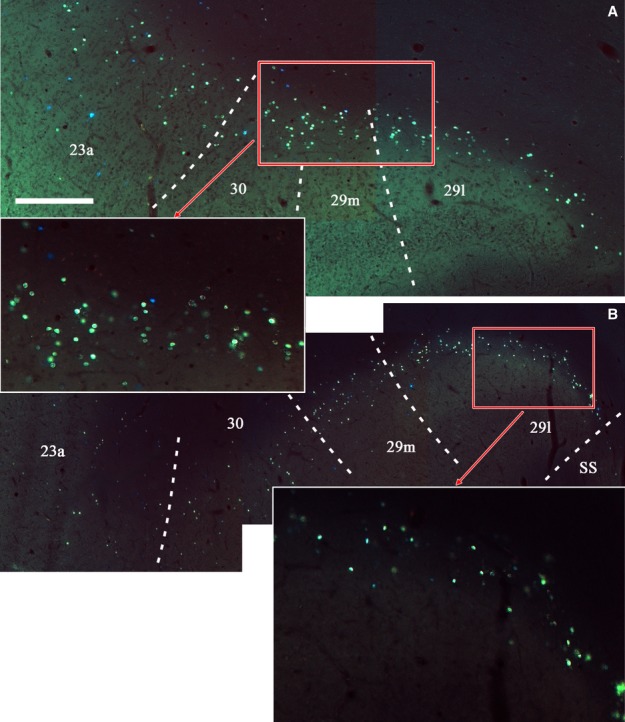
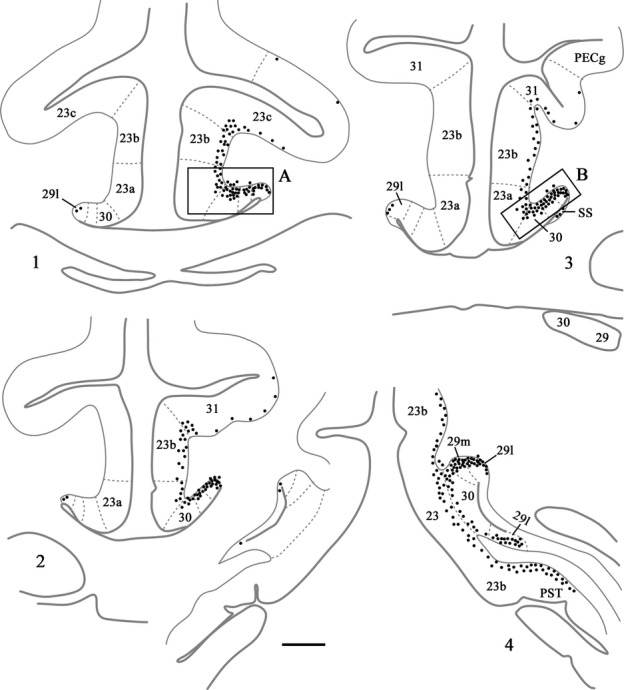
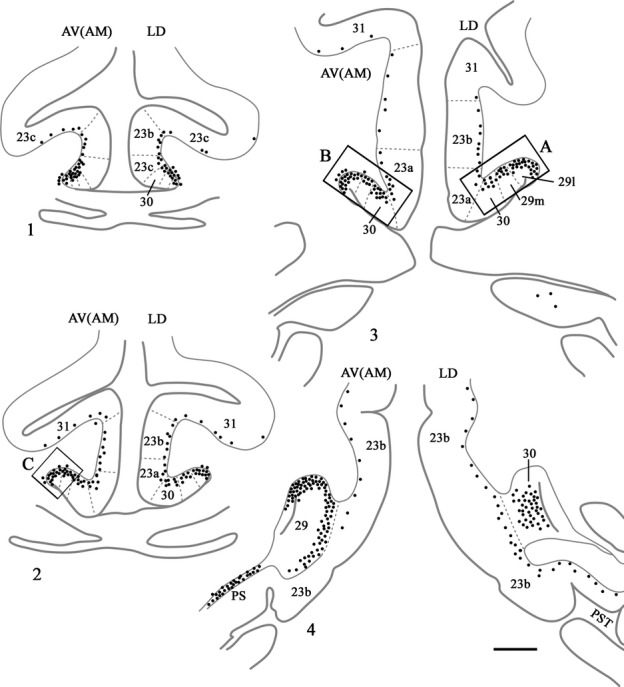
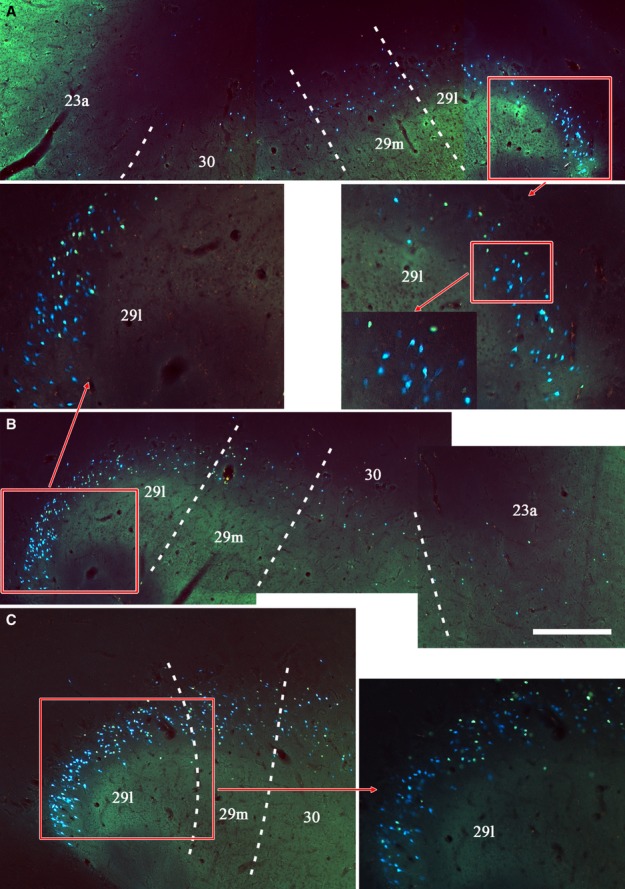
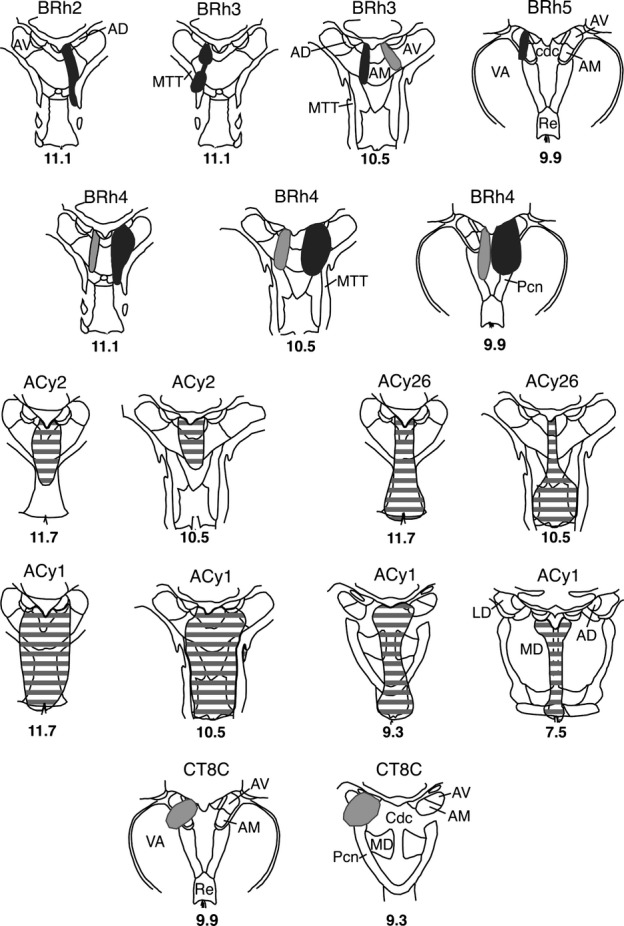
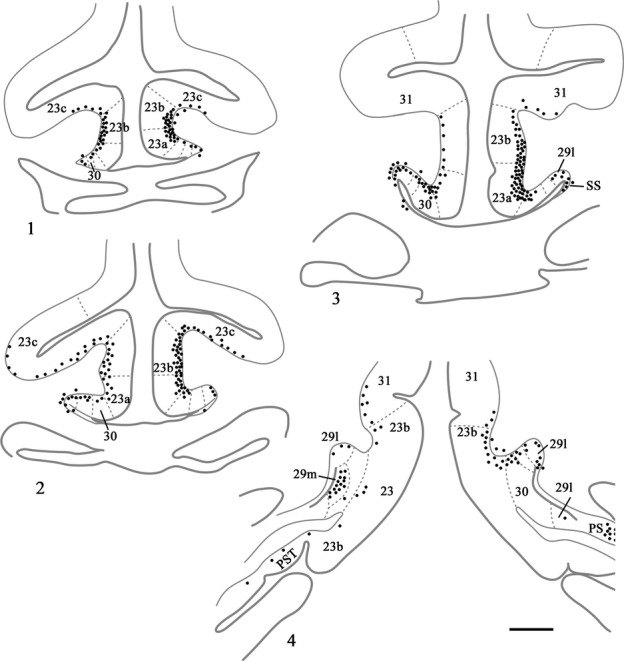
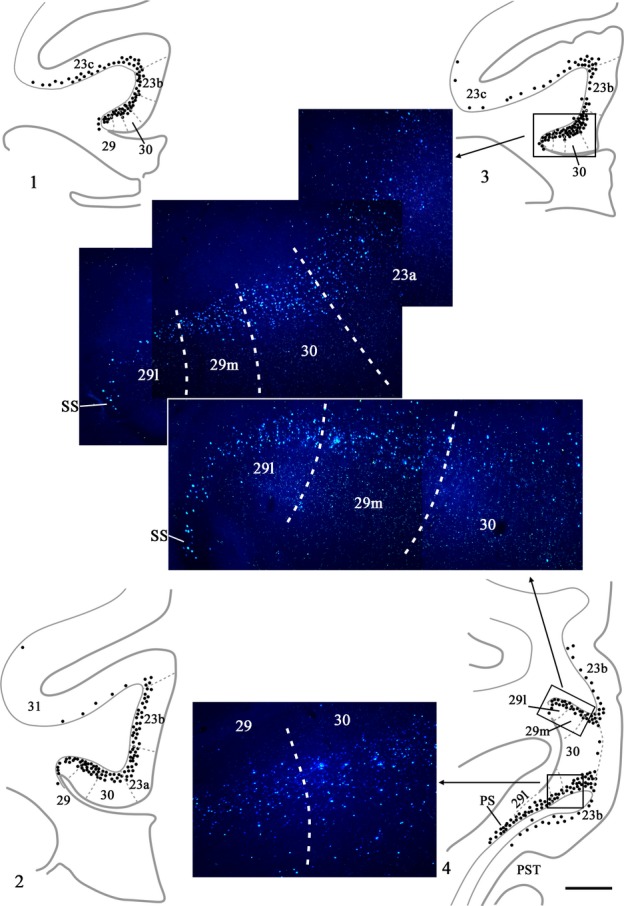
Interactions between the posterior cingulate cortex (areas 23 and 31) and the retrosplenial cortex (areas 29 and 30) with the anterior, laterodorsal and dorsal medial thalamic nuclei are thought to support various aspects of cognition, including memory and spatial processing. To detail these interactions better, the present study used retrograde tracers to reveal the origins of the corticothalamic projections in two closely related monkey species (Macaca mulatta, Macaca fascicularis). The medial dorsal thalamic nucleus received only light cortical inputs, which predominantly arose from area 23. Efferents to the anterior medial thalamic nucleus also arose principally from area 23, but these projections proved more numerous than those to the medial dorsal nucleus and also involved additional inputs from areas 29 and 30. The anterior ventral and laterodorsal thalamic nuclei had similar sources of inputs from the posterior cingulate and retrosplenial cortices. For both nuclei, the densest projections arose from areas 29 and 30, with numbers of thalamic inputs often decreasing when going dorsal from area 23a to 23c and to area 31. In all cases, the corticothalamic projections almost always arose from the deepest cortical layer. The different profiles of inputs to the anterior medial and anterior ventral thalamic nuclei reinforce other anatomical and electrophysiological findings suggesting that these adjacent thalamic nuclei serve different, but complementary, functions supporting memory. While the lack of retrosplenial connections singled out the medial dorsal nucleus, the very similar connection patterns shown by the anterior ventral and laterodorsal nuclei point to common roles in cognition.

Keywords: cingulate cortex; memory; primate; retrosplenial cortex; thalamus.


Figures

Figure 1
Figure 1
Photomicrographs (1–3) of Nissl stained coronal sections from a rhesus monkey (Macaca mulatta) showing the location and arrangement of the various areas within the posterior cingulate and retrosplenial cortices (areas 23, 29, 30 and 31). At more rostral levels (1 and 2) the posterior cingulate cortex is entirely dorsal to the corpus callosum. Caudal to the splenium (3) both the posterior cingulate and retrosplenial cortices extend ventrally below the splenium. PECg, parietal area PE, cingulate portion; PS, prosubiculum; PST, prostriate cortex. Scale bars, 1.0 mm.
Figure 2
Figure 2
Location and extent of retrograde tracer injections involving the medial dorsal and laterodorsal thalamic nuclei. The injection sites are depicted on standard coronal sections of the medial thalamus. Each animal received an injection of FB (dark grey shading), DY (light grey shading) or both. Case numbers or names are placed above each section. The lower numbers correspond to levels depicted by Olszewski (1952), such that higher numbers are more rostral. AD, anterior dorsal thalamic nucleus; LD, laterodorsal thalamic nucleus; MD, medial dorsal thalamic nucleus.
Figure 3
Figure 3
Drawings of six coronal sections in a case (CT8C) with a single injection of FB located in the magnocellular part of the medial dorsal nucleus. In this case each dot represents a single labelled cell within the cortex; 1 is the most rostral. CC, corpus callosum; F, fornix; SS, supracallosal subiculum. Scale bar, 1.0 mm.
Figure 4
Figure 4
Drawings of four coronal sections depicting a case (CSR) with a single injection of DY placed in the medial dorsal nucleus. In this case each dot represents two labelled cells within the cortex. Section 4.1 is the most rostral. Scale bar, 1.5 mm.
Figure 5
Figure 5
Photomicrographs of the two retrosplenial areas outlined in Fig.6 (A and B). The data, which are from Case BRh6, show the location and density of fluorescently labelled cells (DY) ipsilateral to an injection in the right laterodorsal thalamic nucleus. The two insets show specific subregions at a higher magnification. While the overwhelming majority of cells are DY (greenish yellow in appearance), there is a scattering of FB (blue) cells, especially in area 23a. These cells arise from the injections into the medial dorsal nucleus in the same hemisphere. Scale bar, 500 μm.
Figure 6
Figure 6
Distribution of retrograde label (Case BRh6) following an injection of DY into the laterodorsal nucleus in the right hemisphere, along with a second injection largely confined to the midline thalamic nuclei (see Fig.2). The dots reflect the relative distributions of labelled cells with each dot representing approximately three labelled cells (see Fig.5). Note the lack of labelled cells contralateral to the lateral dorsal thalamic injection. Photomicrographs of the two areas in boxes (A and B) are shown in Fig.5. PECg, parietal area; PE, cingulate portion; PST, prostriate cortex. Scale bar, 1.0 mm.
Figure 7
Figure 7
Distribution of retrograde label (Case BRh5) following an injection of FB into the caudal part of the anterior ventral nucleus in the left hemisphere, along with a second injection of FB into the laterodorsal thalamic nucleus in the right hemisphere. The dots reflect the relative distributions of labelled cells as there were too many to depict individually (see Fig.8). Photomicrographs of the three areas in boxes (A, B and C) are shown in Fig.8. PS, prosubiculum; PST, prostriate cortex. Scale bar, 2.0 mm.
Figure 8
Figure 8
Photomicrographs from Case BRh5 showing the three areas of retrosplenial cortex identified by boxes A, B and C in Fig.7. Box A is ipsilateral to an FB injection in the laterodorsal thalamic nucleus (right hemisphere). Boxes B and C show the location and density of fluorescently labelled cells (FB) ipsilateral to an injection in the anterior ventral nucleus (left hemisphere). The insets show specific subregions at higher magnifications. While the large majority of labelled cells are blue, it can be seen that there are also numerous DY-labelled cells (lime green colour) that show a similar distribution. This additional label cells is a result of the DY injection into the lateral dorsal nucleus in the left hemisphere (not described as there is also uptake of this tracer by the corpus callosum). Scale bar, 500 μm.
Figure 9
Figure 9
Location and extent of retrograde tracer injections involving the anterior medial and anterior ventral thalamic nuclei. The injection sites are depicted on standard coronal sections depicting the medial thalamus. Five animals received an injection of either FB (dark grey shading), DY (light grey shading) or both. Three cases received a single injection of HRP (grey horizontal lines). Case numbers or names are placed above each section. The numbers below correspond to levels depicted by Olszewski (1952), such that the higher numbers are more rostral. AD, anterior dorsal thalamic nucleus; AM, anterior medial nucleus; AV, anterior ventral nucleus; Cdc, nucleus centralis densocellularis; MD, medial dorsal thalamic nucleus; MTT, mammillothalamic tract; Pcn, nucleus paracentralis; Re, nucleus reuniens; VA, ventral anterior nucleus.
Figure 10
Figure 10
Distribution of retrograde label (Case BRh2) following an injection of FB into the midline and anterior medial thalamic nucleus in the right hemisphere (with minor involvement of the left hemisphere). The dots reflect the relative distributions of labelled cells as there were too many to depict individually (see text). Note the appreciable numbers of labelled cells contralateral to the anterior medial thalamic injection. PS, presubiculum; PST, prostriate cortex; SS, supracallosal subiculum. Scale bar, 2.0 mm.
Figure 11
Figure 11
Drawings showing four coronal sections from case CT8C, which received a single injection of DY in the left anterior thalamus (anterior dorsal, anterior medial and anterior ventral nuclei). The dots reflect the relative distributions of labelled cells. The three areas in boxes are shown in the photomicrographs. In these photomicrographs the DY-labelled cells appear blue. PS, presubiculum; PST, prostriate cortex; SS, supracallosal subiculum. Scale bar, 2.0 mm.

References

    1. Aggleton JP. Understanding anterograde amnesia: disconnections and hidden lesions. Q. J. Exp. Psychol. 2008;61:1441–1471. - PubMed
    1. Aggleton JP. Brown MW. Episodic memory, amnesia, and the hippocampal-anterior thalamic axis. Behav. Brain Sci. 1999;22:425–444. - PubMed
    1. Aggleton JP. Mishkin M. Projections of the amygdala to the thalamus in the cynomolgus monkey. J. Comp. Neurol. 1984;222:56–68. - PubMed
    1. Aggleton JP, Desimone R. Mishkin M. The origin, course, and termination of the hippocampo-thalamic projections in the macaque. J. Comp. Neurol. 1986;243:409–421. - PubMed
    1. Aggleton JP, O'Mara SM, Vann SD, Wright NF, Tsanov M. Erichsen JT. Hippocampal - anterior thalamic pathways for memory: uncovering a network of direct and indirect actions. Eur. J. Neurosci. 2010;31:2292–2307. - PMC - PubMed

Publication types

MeSH terms

LinkOut - more resources