

Mixture modeling methods for the assessment of normal and abnormal personality, part I: cross-sectional models
- PMID: 24134433
- PMCID: PMC4323162
- DOI: 10.1080/00223891.2013.845201
Mixture modeling methods for the assessment of normal and abnormal personality, part I: cross-sectional models
Abstract
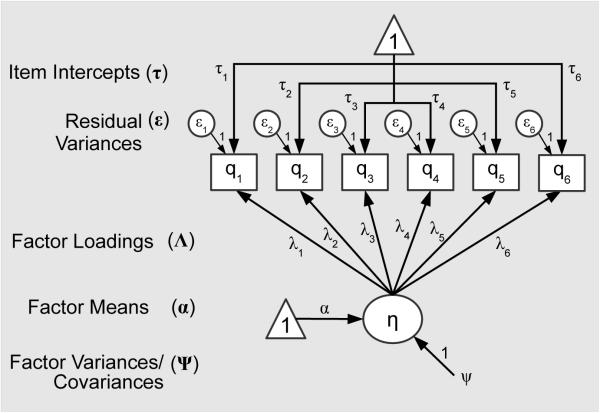
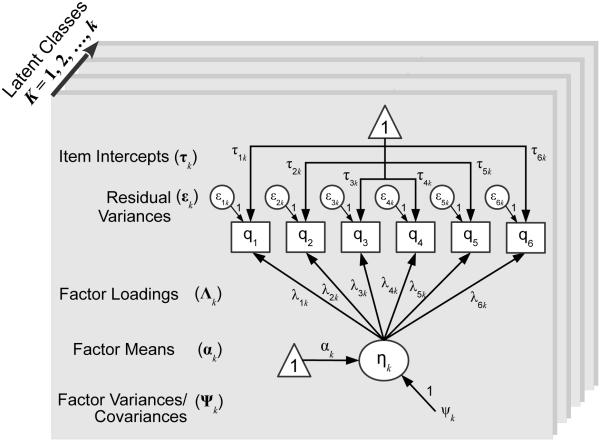
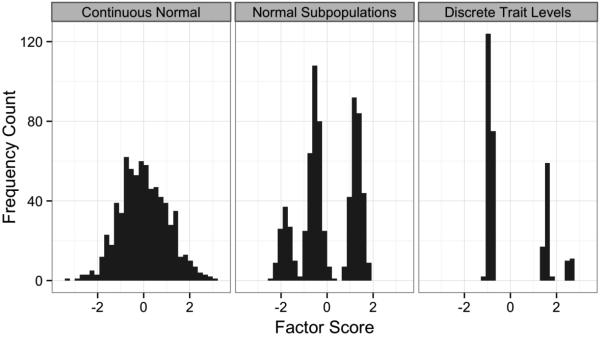
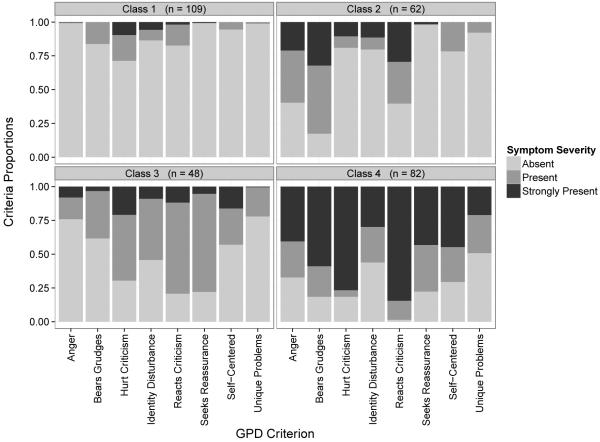
Over the past 75 years, the study of personality and personality disorders has been informed considerably by an impressive array of psychometric instruments. Many of these tests draw on the perspective that personality features can be conceptualized in terms of latent traits that vary dimensionally across the population. A purely trait-oriented approach to personality, however, might overlook heterogeneity that is related to similarities among subgroups of people. This article describes how factor mixture modeling (FMM), which incorporates both categories and dimensions, can be used to represent person-oriented and trait-oriented variability in the latent structure of personality. We provide an overview of different forms of FMM that vary in the degree to which they emphasize trait- versus person-oriented variability. We also provide practical guidelines for applying FMM to personality data, and we illustrate model fitting and interpretation using an empirical analysis of general personality dysfunction.
Figures
Similar articles
-
Mixture modeling methods for the assessment of normal and abnormal personality, part II: longitudinal models.J Pers Assess. 2014;96(3):269-82. doi: 10.1080/00223891.2013.830262. Epub 2013 Sep 5. J Pers Assess. 2014. PMID: 24007339 Free PMC article.
-
Introduction to the special section on mixture modeling in personality assessment.J Pers Assess. 2014;96(3):253-5. doi: 10.1080/00223891.2013.866572. Epub 2013 Dec 30. J Pers Assess. 2014. PMID: 24377414
-
Integrating normal and abnormal personality structure: the Five-Factor Model.J Pers. 2012 Dec;80(6):1471-506. doi: 10.1111/j.1467-6494.2012.00776.x. J Pers. 2012. PMID: 22320149
-
Toward a process-based framework for classifying personality tests: comment on Meyer and Kurtz (2006).J Pers Assess. 2007 Oct;89(2):202-7. doi: 10.1080/00223890701518776. J Pers Assess. 2007. PMID: 17764397 Review.
-
The problem of severity in the classification of personality disorder.J Pers Disord. 2005 Jun;19(3):309-14. doi: 10.1521/pedi.2005.19.3.309. J Pers Disord. 2005. PMID: 16175739 Review.
Cited by
-
MplusAutomation: An R Package for Facilitating Large-Scale Latent Variable Analyses in Mplus.Struct Equ Modeling. 2018;25(4):621-638. doi: 10.1080/10705511.2017.1402334. Epub 2018 Jan 19. Struct Equ Modeling. 2018. PMID: 30083048 Free PMC article.
-
Focusing personality assessment on the person: Modeling general, shared, and person specific processes in personality and psychopathology.Psychol Assess. 2019 Apr;31(4):502-515. doi: 10.1037/pas0000617. Psychol Assess. 2019. PMID: 30920277 Free PMC article.
-
Disorganized attachment and personality functioning in adults: A latent class analysis.Personal Disord. 2017 Jul;8(3):206-216. doi: 10.1037/per0000184. Epub 2016 Mar 17. Personal Disord. 2017. PMID: 26986959 Free PMC article.
-
Factors of psychological distress: clinical value, measurement substance, and methodological artefacts.Soc Psychiatry Psychiatr Epidemiol. 2015 Apr;50(4):515-24. doi: 10.1007/s00127-015-1022-5. Epub 2015 Feb 15. Soc Psychiatry Psychiatr Epidemiol. 2015. PMID: 25682108 Review.
-
Heterogeneity of borderline personality disorder symptoms in help-seeking adolescents.Borderline Personal Disord Emot Dysregul. 2021 Feb 26;8(1):9. doi: 10.1186/s40479-021-00147-9. Borderline Personal Disord Emot Dysregul. 2021. PMID: 33722308 Free PMC article.
References
-
- Akaike H. A new look at the statistical model identification. IEEE Transactions on Automatic Control. 1974;19(6):716–723.
-
- Allport GW. Concepts of trait and personality. Psychological Bulletin. 1927;24(5):284–293.
-
- American Psychiatric Association . Diagnostic and Statistical Manual of Mental Disorders (DSM-III-R) (3rd, revised.) Author; Washington, DC: 1987.
-
- Beck SJ. The science of personality: nomothetic or idiographic? Psychological Review. 1953;60(6):353. - PubMed
-
- Bem DJ. Constructing a theory of the triple typology: Some (second) thoughts on nomothetic and idiographic approaches to personality. Journal of Personality. 1983;51(3):566–577. - PubMed
Publication types
MeSH terms
Grants and funding
LinkOut - more resources
Full Text Sources
Other Literature Sources
Miscellaneous