. 2013 Nov;123(11):4888-99.
doi: 10.1172/JCI66218. Epub 2013 Oct 25.

AMPK dysregulation promotes diabetes-related reduction of superoxide and mitochondrial function

AMPK dysregulation promotes diabetes-related reduction of superoxide and mitochondrial function

Laura L Dugan et al. J Clin Invest. 2013 Nov.

Abstract

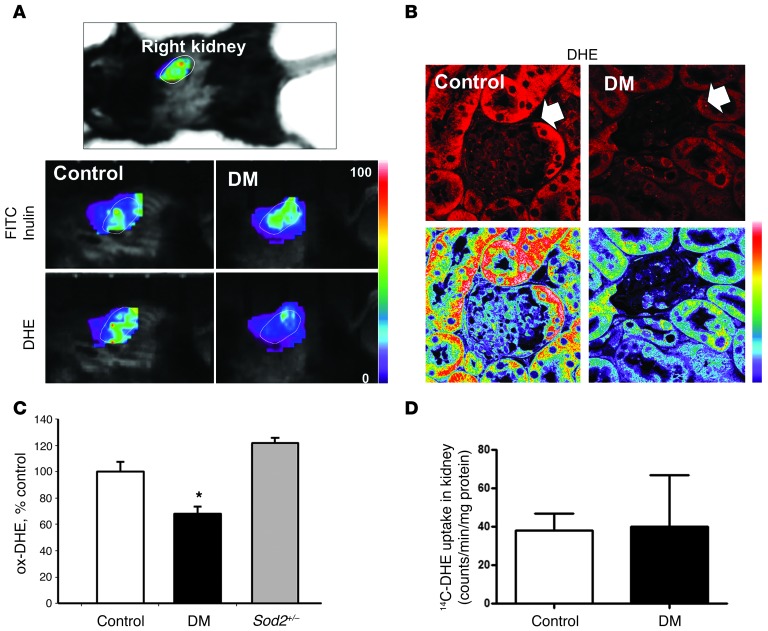
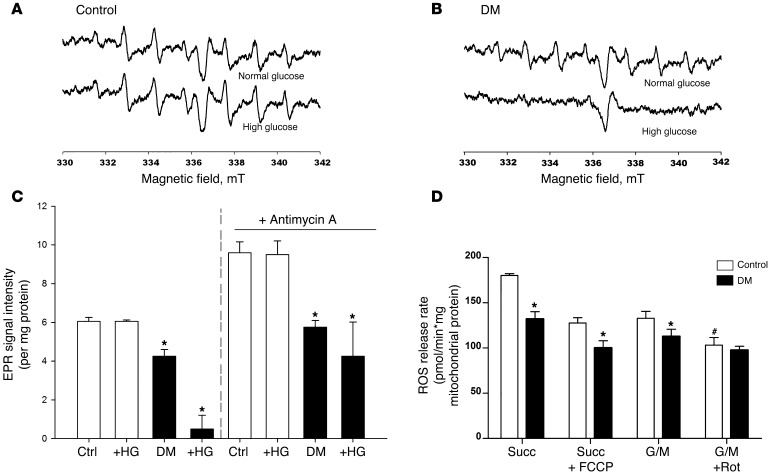
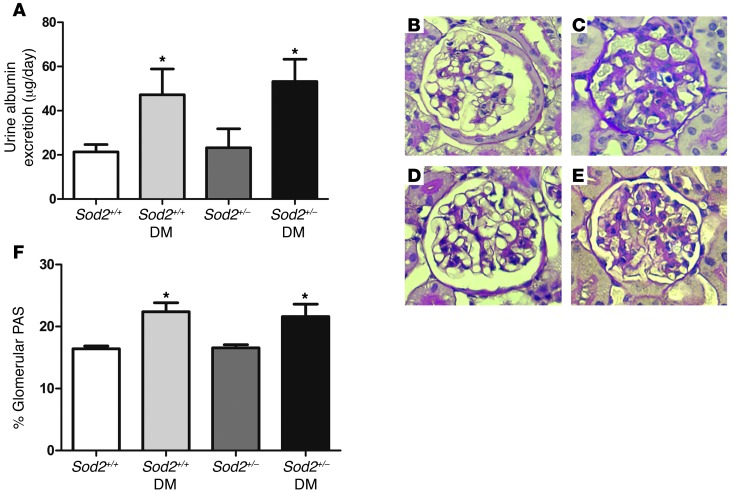
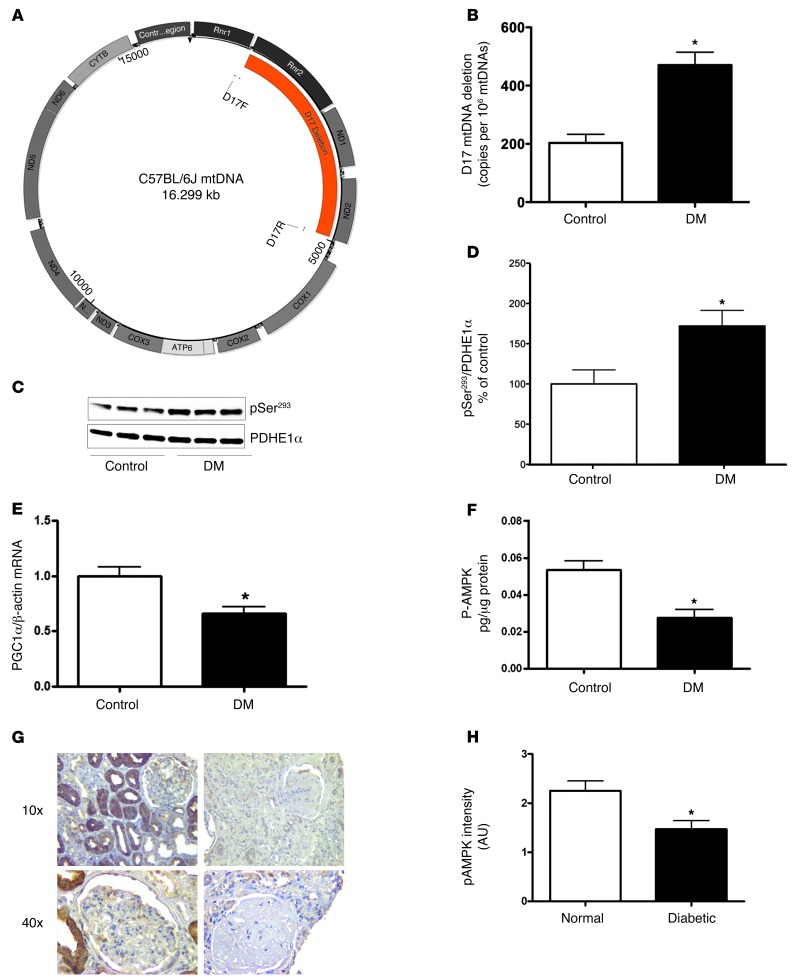
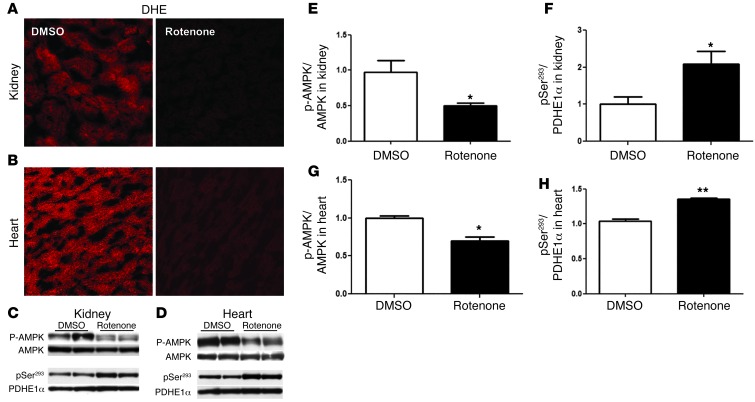
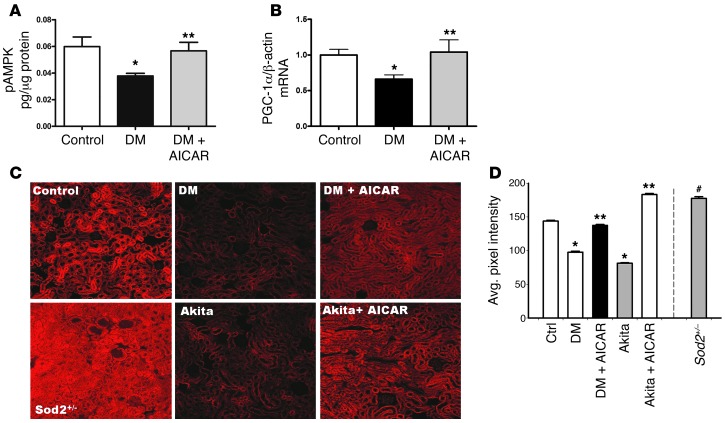
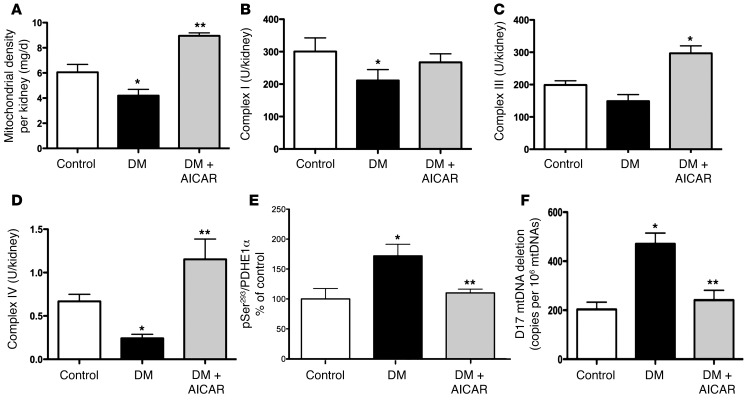
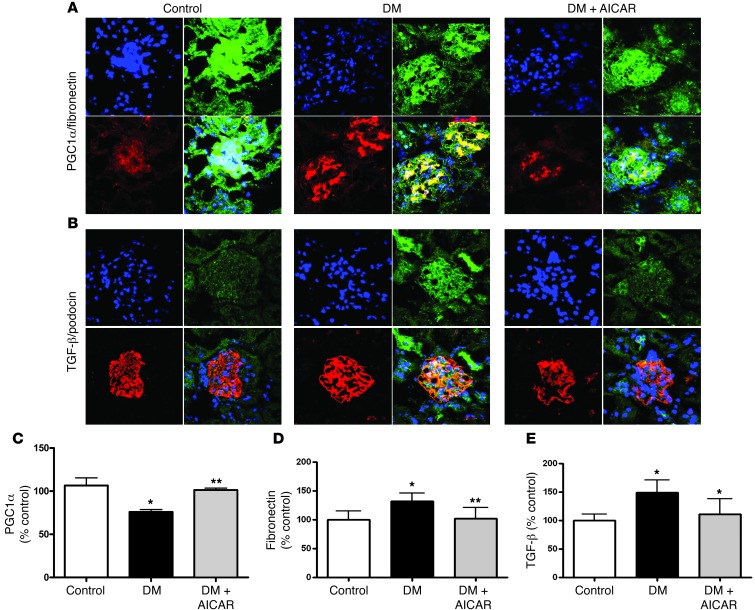
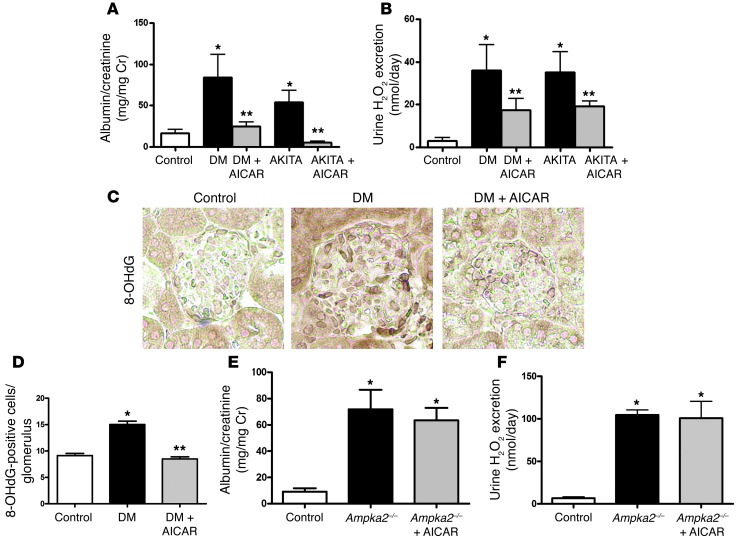
Diabetic microvascular complications have been considered to be mediated by a glucose-driven increase in mitochondrial superoxide anion production. Here, we report that superoxide production was reduced in the kidneys of a steptozotocin-induced mouse model of type 1 diabetes, as assessed by in vivo real-time transcutaneous fluorescence, confocal microscopy, and electron paramagnetic resonance analysis. Reduction of mitochondrial biogenesis and phosphorylation of pyruvate dehydrogenase (PDH) were observed in kidneys from diabetic mice. These observations were consistent with an overall reduction of mitochondrial glucose oxidation. Activity of AMPK, the major energy-sensing enzyme, was reduced in kidneys from both diabetic mice and humans. Mitochondrial biogenesis, PDH activity, and mitochondrial complex activity were rescued by treatment with the AMPK activator 5-aminoimidazole-4-carboxamide-1-β-D-ribofuranoside (AICAR). AICAR treatment induced superoxide production and was linked with glomerular matrix and albuminuria reduction in the diabetic kidney. Furthermore, diabetic heterozygous superoxide dismutase 2 (Sod2(+/-)) mice had no evidence of increased renal disease, and Ampka2(-/-) mice had increased albuminuria that was not reduced with AICAR treatment. Reduction of mitochondrial superoxide production with rotenone was sufficient to reduce AMPK phosphorylation in mouse kidneys. Taken together, these results demonstrate that diabetic kidneys have reduced superoxide and mitochondrial biogenesis and activation of AMPK enhances superoxide production and mitochondrial function while reducing disease activity.


Figures

Figure 1
Figure 1. Imaging of kidney superoxide production in normal and diabetic mice.
(A) Live animal imaging of kidney through the intact skin in a prone, isofluorane-anesthetized mouse. Kidneys were first localized using the FITC channel, and then the filter settings were changed to the ox-DHE channel (Ex 470 nm, EM > 590 nm) to image superoxide production in control and STZ-induced diabetic mice (DM). Fluorescence is shown using a linear pseudocolor scale (images representative of n = 6 mice per group). Original magnification, ×1 (top panel); ×1.25 (bottom panels). (B) ox-DHE fluorescence (red, top; linear pseudocolor, bottom) in kidney slices prepared from DHE-injected control and DM mice with less in vivo oxidation in DM kidney. Diabetic kidneys had a reduced level of glomerular DHE oxidation-derived fluorescence (white arrow). Original magnification, ×63. (C) Kidneys from Sod2+/– mice, which are deficient in mitochondrial SOD, were evaluated and demonstrated the expected higher superoxide than controls. n ≥ 15 each for control and diabetic groups, n = 3 for Sod2+/– group, *P < 0.05 vs control. (D) In vivo analysis of [14C]-labeled DHE with STZ-diabetic mice and control mice.
Figure 2
Figure 2. EPR spectra and ROS release rate in control and diabetic kidney mitochondria.
Dissociated kidney cell suspensions from control (A) or diabetic (B) animals were prepared as described and analyzed by EPR using DPMPO as the spin probe 10 minutes after addition of the mitochondrial substrates malate and pyruvate. The characteristic spectrum for the superoxide-DPMPO was observed in both control and diabetic samples at baseline. However, addition of high glucose (bottom traces) did not increase mitochondrial superoxide production and, in the diabetic kidney samples, actually reduced superoxide production. (C) Analysis of the EPR signal intensity using the upfield peak at 334 mT, normalized to mg protein. Values are mean ± SEM, n = 6 per condition, *P < 0.05 vs control. The second set of bars to the right show data derived from Supplemental Figure 3, which shows additional spectra from samples after addition of the mitochondrial complex III inhibitor, antimycin A. Antimycin A produced the expected increase in superoxide, confirming the ability of this technique to detect increased mitochondrial superoxide production if present. (D) Decreased ROS release from kidney mitochondria isolated from diabetic animals Measurements were made in the presence of succinate (Succ), succinate and FCCP (Succ + FCCP), glutamate plus malate (G/M) or glutamate plus malate with rotenone (G/M + Rot) by Amplex Red assay. Rates were calculated using calibration curve as described in Methods. Values are mean ± SEM, n = 5–8. *P < 0.001 vs. corresponding control; #P < 0.05 vs. G/M.
Figure 3
Figure 3. Diabetic kidney disease in Sod2+/– mice.
(A) Albumin excretion for 24 hours, n = 9–10 each, *P < 0.05, compared with corresponding control group. Values are mean ± SEM. (BE) PAS staining of (B) Sod2+/+, (C) Sod2+/+ diabetic, (D) Sod2+/–, and (E) Sod2+/– diabetic mice. (F) Glomerular extracellular matrix expressed with percentage of the total glomerular area stained with PAS. n = 6–7. *P < 0.001, compared with corresponding control group. Original magnification, ×40.
Figure 4
Figure 4. Mitochondrial structure and function, PGC1α, and p-AMPK in the diabetic kidney.
(A) Map of murine mtDNA indicating the location of the D17 deletion. (B) Quantitation of the D17 mtDNA deletion in kidney DNA from control and diabetic mice, (n = 6 per group, *P < 0.05). (C) Representative immunoblot analysis of phosphorylated PDHE1α-pSer293 in kidney mitochondria (upper panel) and total PDHE1α (lower panel) from control and diabetic mice. (D) Quantitative analysis of the immunoblot results showing that, under conditions of diabetes, PDH is hyperphosphorylated (n = 6 per group, *P < 0.05). (E) PGC1α is reduced in diabetic kidneys as demonstrated by real time PCR analysis of control and diabetic kidneys (n = 6 per group, *P < 0.05) and immunofluorescence staining with an antibody to PGC1α in Supplemental Figure 2A. (F) p-AMPK was reduced in the diabetic kidneys, as demonstrated with an ELISA using kidney cortex from control and diabetic mice (n = 7 per group, *P < 0.05) and with immunofluorescence staining with an antibody specific for p-Thr172 of the AMPKα subunit in Supplemental Figure 2B. (G) Representative images of immunostaining of p-AMPK in normal, diabetic kidney and negative control. Original magnification, ×40. (H) Semiquantitative scoring of p-AMPK intensity in glomeruli of human normal (n = 10) and diabetic kidney (n = 7 per group, *P < 0.05).
Figure 5
Figure 5. Rotenone reduces superoxide production in kidney and heart in association with reduced p-AMPK and increased p-PDH phosphorylation.
C57BL/6J mice were injected i.p. with either 1 μg/g rotenone (0.5 mg/ml stock) in DMSO or DMSO vehicle 1 time, 3 hours before harvesting organ. Confocal imaging of sliced kidney (A) and heart (B) from DHE-injected DMSO-treated control group (DMSO) and rotenone-treated group (rotenone). Rotenone treatment was initiated 30 minutes before injection with DHE (n = 3 mice per group). Original magnification, ×25. Representative immunoblot analysis and quantitative analysis of phosphorylated PDHE1a -pSer293 and p-AMPK in kidney (C, E, and F) and heart (D, G, and H) from DMSO-treated control and rotenone-treated mice. (n = 6 per group, *P < 0.05 vs. DMSO; **P < 0.05 vs. DMSO).
Figure 6
Figure 6. AICAR increases AMPK activity and PGC1α expression in the diabetic kidneys, and AMPK activation reverses superoxide production.
(A) p-AMPK was increased in diabetic kidneys treated with AICAR (n > 7 per group, *P < 0.05 vs control, **P < 0.05 vs STZ-diabetes). (B) PGC1α gene expression was increased in the diabetic kidneys treated with AICAR as demonstrated by real-time PCR analysis (n = 6 per group, *P < 0.05 vs. control, **P < 0.05 vs. STZ-diabetes). (C) Representative confocal fluorescent images of DHE oxidation indicate that superoxide is reduced in kidneys of STZ-induced diabetic and Akita diabetic mice (AKITA) and is restored in both models by AICAR. Original magnification, ×10. Sod2+/– mice increase in DHE oxidation. (D) Quantification of renal superoxide in control, diabetic, Sod2+/–, and diabetic mice treated with AICAR. (n ≥ 6 per group, *P < 0.05 vs. control; **P < 0.05 vs. corresponding diabetic group; #P < 0.001 vs. other conditions).
Figure 7
Figure 7. AMPK activation reverses diabetes-induced regulation of mitochondrial respiratory chain function, mtDNA deletion, and PDH phosphorylation.
(A) Total mitochondrial content per kidney protein (mg/g), (B) complex I activity, (C) complex III activity, (D) complex IV activity, (E) quantitative analysis of PDH phosphorylation, and (F) D17 mtDNA deletion in kidney DNA measured in control, STZ-diabetic, and STZ-diabetic mice treated with AICAR (DM-AICAR). (n ≥ 6 per group, *P < 0.05 vs. control; **P < 0.05 vs. corresponding diabetic group).
Figure 8
Figure 8. AMPK activation increases PGC1α and reduces fibronectin and TGF-β.
(A) AICAR treatment increased PGC1α (green) in the diabetic kidney concurrently with a reduction in glomerular fibronectin (red). (B) AICAR treatment reduced glomerular TGF-β (green) in diabetic kidneys (podocin staining in red). Confocal images representative of n = 3 mice per group. Original magnification, ×63. Semiquantitative data of immunostaining of PGC1α (C), fibronectin (D), and TGF-β (E) in glomeruli. (n ≥ 6 per group, *P < 0.05 vs control; **P < 0.05 vs corresponding diabetic group).
Figure 9
Figure 9. AMPK activation reduces urine albumin, urine hydrogen peroxide, and glomerular 8-OHdG.
AICAR reduced the urine albumin/creatinine ratio (A) and hydrogen peroxide (H2O2) excretion (B) in the diabetic mice. (n ≥ 8 per group, *P < 0.05 vs. control; **P < 0.05 vs. corresponding diabetic group). (C) Glomerular 8-OHdG content was significantly increased in the diabetic groups and significantly reduced by AICAR treatment by immunoperoxidase staining. Original magnification, ×40. (D) Quantification of 8-OHdG–positive cells per glomerulus. n = 20 glomeruli from each mouse kidney; 3 mice per group. *P < 0.001 vs. control; **P < 0.001 vs. DM. Ampka2–/– mice underwent urine collections and albumin/creatinine ratio (E) and hydrogen peroxide excretion (F) are shown (n = 6 per group, P < 0.05 vs. control).

Comment in

References

    1. Nishikawa T, et al. Normalizing mitochondrial superoxide production blocks three pathways of hyperglycaemic damage. Nature. 2000;404(6779):787–790. doi: 10.1038/35008121. - DOI - PubMed
    1. Brownlee M. Biochemistry and molecular cell biology of diabetic complications. Nature. 2001;414(6865):813–820. doi: 10.1038/414813a. - DOI - PubMed
    1. DeRubertis F, Craven P, Melhem M, Salah E. Attenuation of renal injury in db/db mice overexpressing superoxide dismutase: evidence for reduced superoxide-nitric oxide interaction. Diabetes. 2004;53(3):762–768. doi: 10.2337/diabetes.53.3.762. - DOI - PubMed
    1. Lin CL, et al. Superoxide destabilization of beta-catenin augments apoptosis of high-glucose-stressed mesangial cells. Endocrinology. 2008;149(6):2934–2942. doi: 10.1210/en.2007-1372. - DOI - PubMed
    1. Rinaldi M, Moroni P, Paape MJ, Bannerman DD. Evaluation of assays for the measurement of bovine neutrophil reactive oxygen species. Vet Immunol Immunopathol. 2007;115(1–2):107–125. doi: 10.1016/j.vetimm.2006.09.009. - DOI - PubMed

Publication types

MeSH terms